Working with the Dashboards List (Grid) Page
This video provides an overview of dashboards. Dashboards allow you to display results from several existing reports, charts, and filters, allowing you to provide meaningful sets of information to your dashboard consumers in one viewing space. Duration 6 min.
Note: If you do not see the Dashboards nav icon but expect to, ask your PPM Pro administrator to give you the correct permissions - minimally Dashboards > View.
The Dashboards List is the page that displays when you click the top-level Dashboards icon (dashboards for all entities) or the Dashboards section from an entity (dashboards scoped to the current entity). The Dashboards List displays all the existing dashboards, and allows you to create copy, edit, delete, view, and/or publish dashboards. The exact actions you can perform depend on your permissions and the scope. For example, you can publish dashboards and view previously published dashboards from any dashboard list except the top-level Dashboards.
Remember that dashboards use the profile permission model. So anything a user can do with a dashboard - view, edit, delete, and so on - is determined by permission profiles. The owner of a dashboard minimally has permission to edit/view the dashboard details; any other permissions, such as editing the team, is granted with additional permissions and/or profiles. See About Profile-Based Permissions.
The Dashboards List is the starting place for:
- creating/editing dashboards (using the dashboard designer)
- running existing dashboards
- viewing references (where the dashboard is in use), including when used as a Home/Project overview dashboard, or a drilldown target from a report or dashboard
- bulk adding/removing team members
- changing the dashboard owner
- viewing permissions granted
See The Actions Menu for more information.
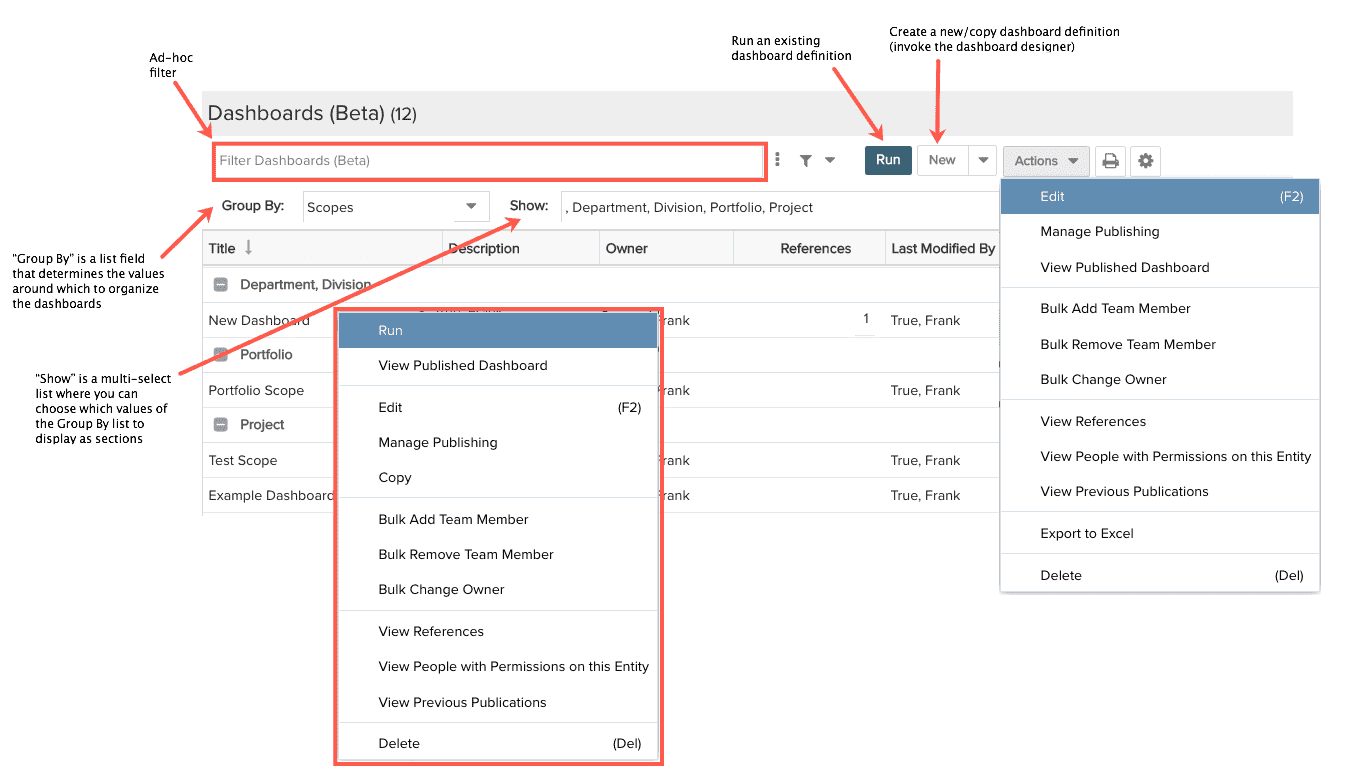
Anatomy of the Dashboards List page
Below is a screenshot of the Dashboards List page, populated with a some dashboards.
Creating and Copying Dashboards - New Menu
The New menu contains the New Dashboard and Copy dashboard items for users with Dashboard > Create permission. If you don't see this button but think you should, contact your PPM Pro administrator.
To create a new dashboard, click New > New Dashboard. This invokes the dashboard designer, where you will configure the dashboard. See Using the Dashboard Designer.
To copy a dashboard, choose New > Copy. This creates an exact copy of the original dashboard definition, opens the dashboard designer, and updates the existing title to "Copy of" <existing title>. The copy will not be permanent until you click Save or Save & Run. You can modify the copy as you'd like.
Organizing the Grid
To organize the dashboards list you'll use a combination of the Group By and Show droplist values. In addition you can show/hide columns using the Configure Dashboards Columns dialog. See also Ad-Hoc Filters for information about filtering the grid.
- The Group By droplist is populated with any single-selection lookup list fields that are available to be placed on the grid (for example, Owner, Scope, Created By). If you wish to remove certain fields from the Group By droplist, remove them from the Dashboards grid. In the example above, the Group By field is Created By, which means all the valid values for Created By are available to show as sections. For example, if you have created reports for project, task, and portfolio topics, those topics will appear in the Show droplist.
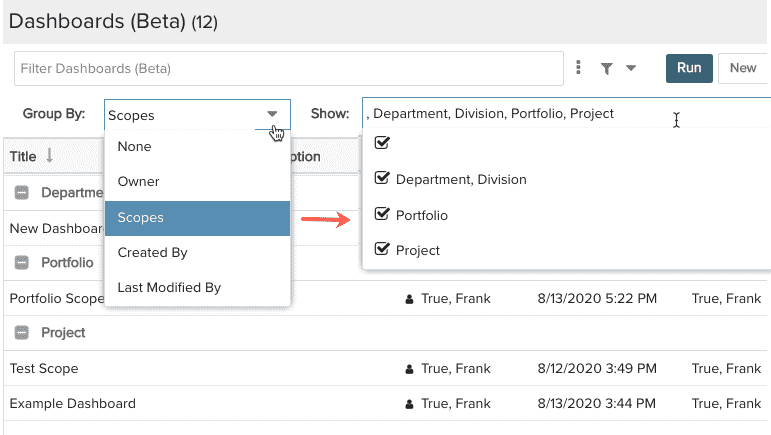
- The Show droplist is a multi-select list that lets you choose which values you want to group by. In the screenshot below, you can see Scope is the selected Group By field - it drives the Show droplist, which contains topic values that correspond to existing dashboards. All the values are selected by default, but you can uncheck any topic to remove that section (and corresponding dashboards) from the grid.
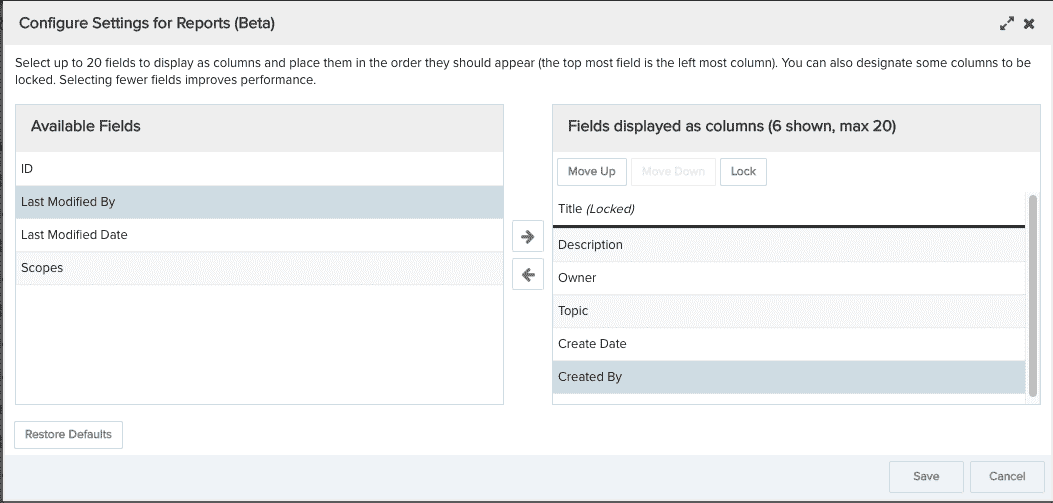
- The Configure Dashboards Columns dialog is where you can add/remove/reorder columns for the Dashboard list. This dialog is similar to the Configure Columns dialogs for other entities, with one major difference: there is a static list of columns that can appear on the dashboards grid, as dashboards are not SSA-enabled. So you can add/remove/reposition the provided set of fields shown in the screenshot below, but you can't add new fields:
Viewing References to a Dashboard
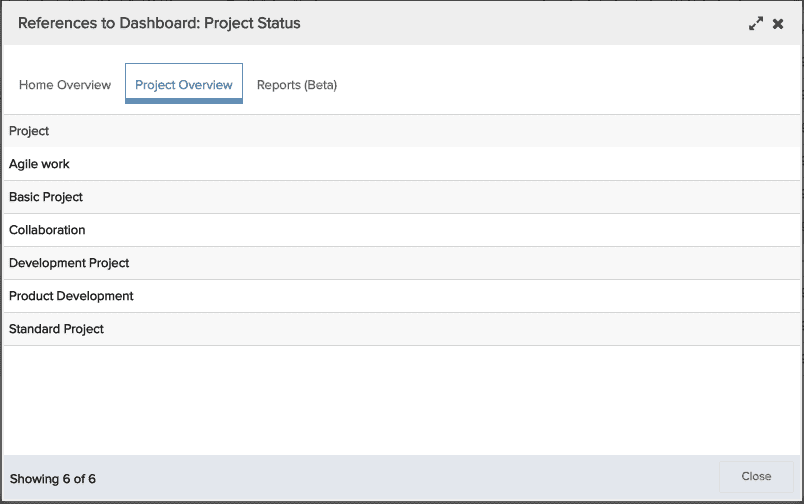
Dashboards can be used in Home and Project Overviews, and they can be targets from drilldowns. The References column in a dashboard list displays the total number of times a dashboard is the drilldown target from a report or dashboard, or is in use as an overview dashboard. This information is useful if you're trying to asses the impact of deleting or modifying the dashboard. The screenshot below shows the View References dialog - 7 projects use this dashboard in their Overview section:
- The Home tab lists the users who use this dashboard in their Home Overview
- The Project Overview tab lists the projects which have this dashboard in their project Overview section
- The Reports tab lists the fields that drilldown to this dashboard, and the report to which they belong
The Actions Menu
|
Action |
Description |
|
|---|---|---|
|
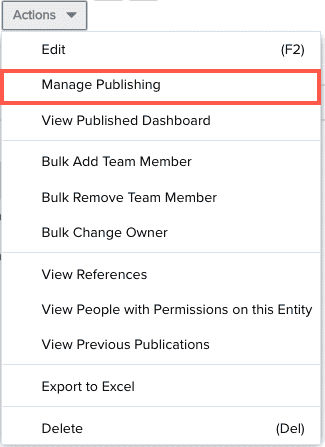
You won’t see the Manage Publishing menu option on the top-level dashboards grid. Permitted users will access Manage Publishing from entity dashboard grids (such as project Dashboards).
|
Run | Run is button in the toolbar, as well as an option in the right-click context menu. Click the Run button or select Run from the context menu to run the selected dashboard. Dashboards are run with the permissions of the current user. See Running and Viewing Dashboards. |
|
Edit |
Brings up the dashboard designer for the selected dashboard definition for users with edit report permission. If you do not have edit permissions but wish to edit the dashboard, make a copy of the report and then edit (need Create permission). |
|
| Manage Publishing | For users with Dashboards > Edit > Publishing, this menu option display the Manage Publishing modal, where you configure publishing options. See Published Dashboards | |
| View Published Dashboard | Published dashboards are distinguished by an icon |
|
|
Copy (from right-click menu) |
Makes a copy of the dashboard definition and invokes the dashboard designer. By default the dashboard definition Title is prefixed with "Copy of:" You can make a copy of any dashboard definition visible to you. You can use Copy if you want to make changes to a report definition created by another user. You need Create permission to copy a dashboard. |
|
| Bulk Add Team Member | Use to add users, groups, or units to the teams of multiple dashboards to quickly provision permissions. See Bulk Sharing Permissions. | |
| Bulk Remove Team Member |
Use to remove users, groups, or units from the teams of multiple dashboards. See Bulk Sharing Permissions. Note that the Bulk Remove Members dialog displays a list of all users/groups/units in the system, and does not reflect actual team membership. |
|
| Bulk Change Owner | Use to assign a new owner to the selected dashboards. Useful if current owner has been terminated, or inactivated, and you want to reassign ownership to active user. | |
| View References | Choose this menu item to display the View References dialog. From there, you can see if the dashboard is used in a Home or Project Overview, or a target from a drilldown. See Viewing References. | |
|
View People with Permissions on this Entity |
Displays the Permissions Explorer with the focus on the current dashboard. See Using the Permissions Explorer. | |
| View Previous Publications |
Every time a dashboard is published, PPM Pro retains a copy of the dashboard publication. For example, if you manually publish a dashboard, and then republish it, you will have two previous versions (and then 3 the next time you republish, and so on). If you have a publishing schedule, versions of all the scheduled republished dashboards will be stored, as well as the initial version that preceded the first scheduled publication. Access these previous publications by right-clicking the published dashboard and choosing View Previous Publications (or selecting the dashboard and choosing Actions > View Previous Publications). See Viewing Published Dashboards. |
|
| Export to Excel | Exports the selected dashboard to excel - each report component is store in a separate worksheet. | |
|
Delete |
Deletes the selected dashboard definition for users with Delete permission; you will be prompted to confirm the delete. |