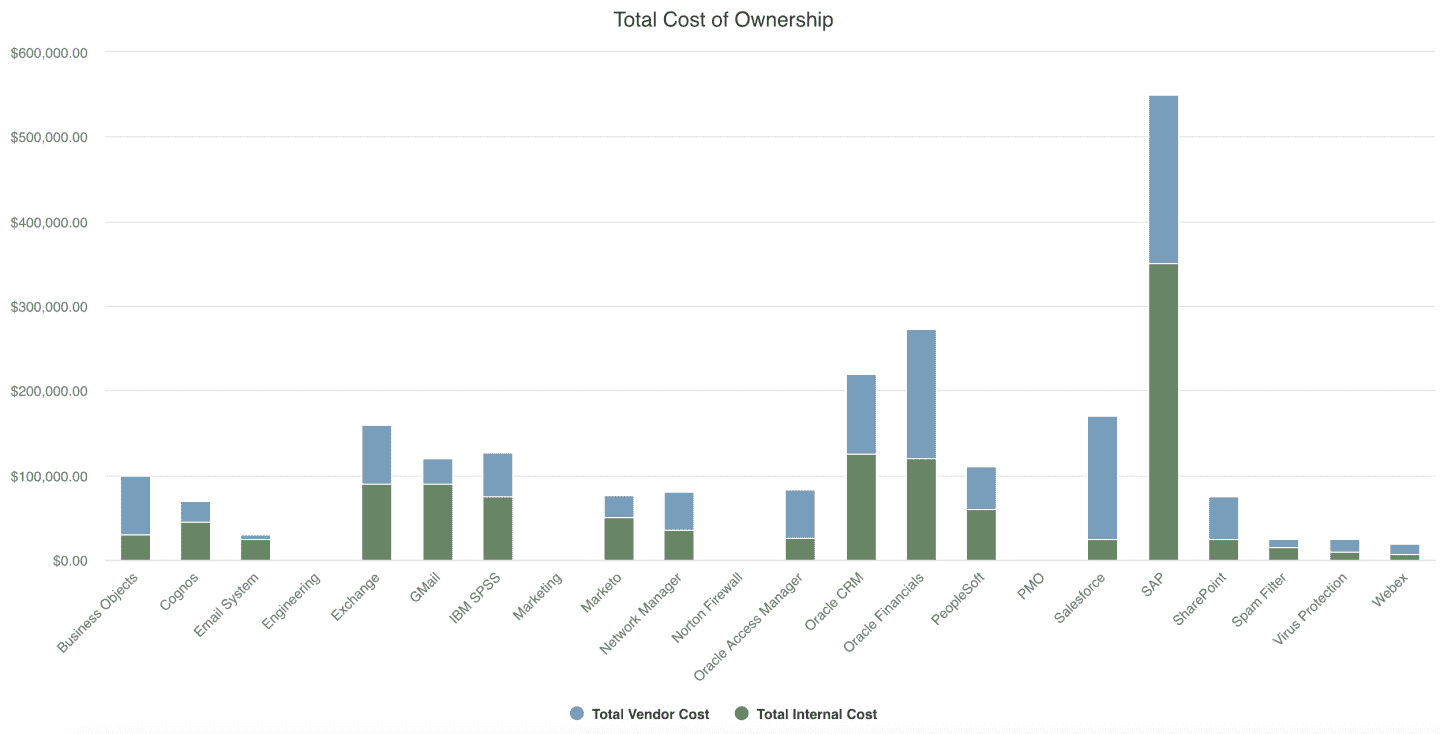
Total Cost of Ownership
This report shows total overall cost of application ownership, using a stacked bar chart to display the breakdown of types of costs. The example is for total cost of ownership for an organization's applications, but it could be extrapolated to other portfolios or work entities. You can build this report using the design settings in the table below. Alternatively, you can download this report definition and upload it to your PPM Pro instance. Please note that if you use the report definition file to create this report in your instance, the user-defined field used in this example recipe will not be in your instance and you will need to select a Left Axis field in the resulting report.
| Design View | Selection | Comments |
|---|---|---|
| General |
Topic: Portfolio Type: Column: Stacked Title: <enter a meaningful title>
|
Other report Types that work well include Area: Stacked, Bar: Stacked, Line, and Spiderweb. |
| Data |
Bottom Axis: Title Left Axis: <up to 10 distinct/non-overlapping portfolio financial cost fields, such as Annual Maintenance Cost and Budget Cost, or as another example, Capitalized Cost and Non-Capitalized Cost, and so on> This report is an example showing a user-defined field "Total Vendor Cost". You can use any application portfolio field of your choice. Please note that if you download the report definition file, this user-defined field will not be in your instance and you will need to select a Left Axis field in the resulting report. |
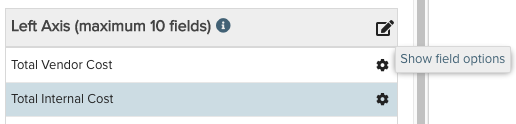
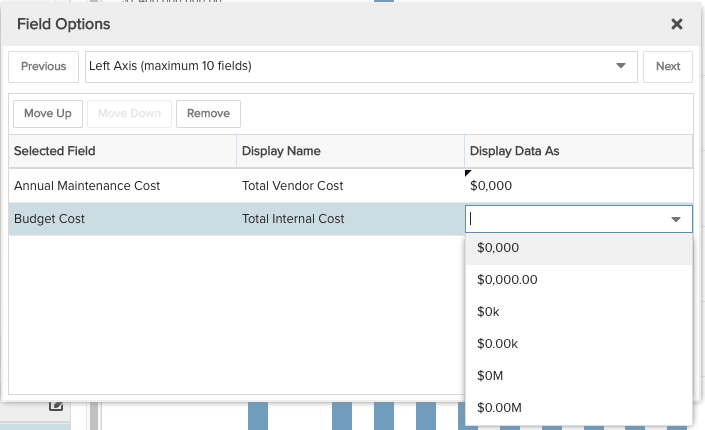
This report is an example showing a user-defined field "DBMS" that is a lookup list. You can use any application portfolio discrete field of your choice. Please note that if you download the report definition file, this user-defined field will not be in your instance and you will need to select a Left Axis field in the resulting report. To change the data field labels for the Legend or the Display Data As options, within the Left Axis area title select the edit icon for "Show Field Options":
|
| Display | Configure Display options, such as whether or not to show Data values. | |
| Variable Settings |
Scope: Portfolio Filters: optionally include a portfolio filter, such as for identifying application portfolios only
|
If you want to allow the user to change to a different Scope and/or Filter before running the report or when viewing the report, select the relevant checkboxes for Allow changing. |