
Portfolio Roadmap
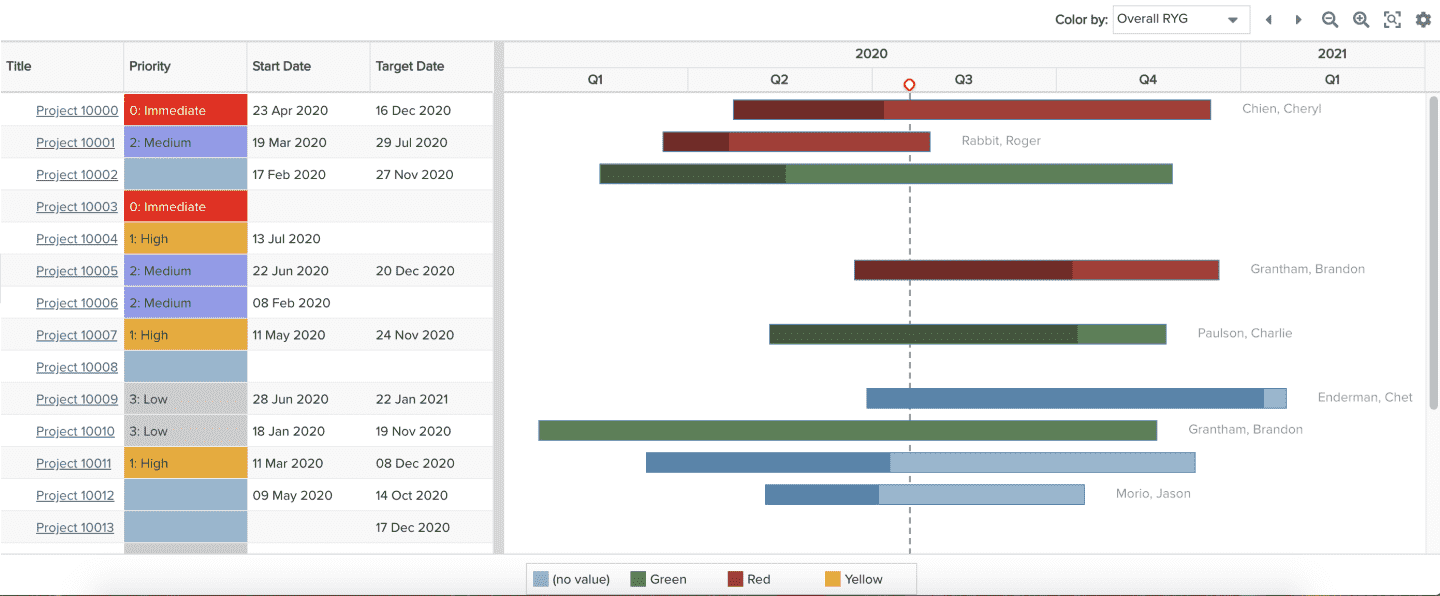
View the roadmap of a portfolio's projects by start and target date, including key project details. For example, show columns for project Title (with drilldown to the project entity), Priority, Start Date, and Target Date, with a Gantt showing each project's progress using the project's % Complete and also showing the project Business Sponsor. You can build this report using the design settings in the table below. Alternatively, you can download this report definition and upload it to your PPM Pro instance.
| Design View | Selection | Comments |
|---|---|---|
| General |
Topic: Project Type: Gantt Title: <enter a meaningful title>
|
|
| Data |
Gantt Bars: Set Bar #1 Start Date to the project Start Date field, and, Bar #1 End Date to the project Target Date field (or whatever fields you want to represent the beginning and end of the Gantt bar) List Fields: Whichever of the following and others would be of value, such as:
|
Note that a Gantt bar, whether Bar #1 or Bar #2 only shows if both the selected Start and End date fields have values. If you would like to show a second bar, you can:
|
| Display and Preview List Columns |
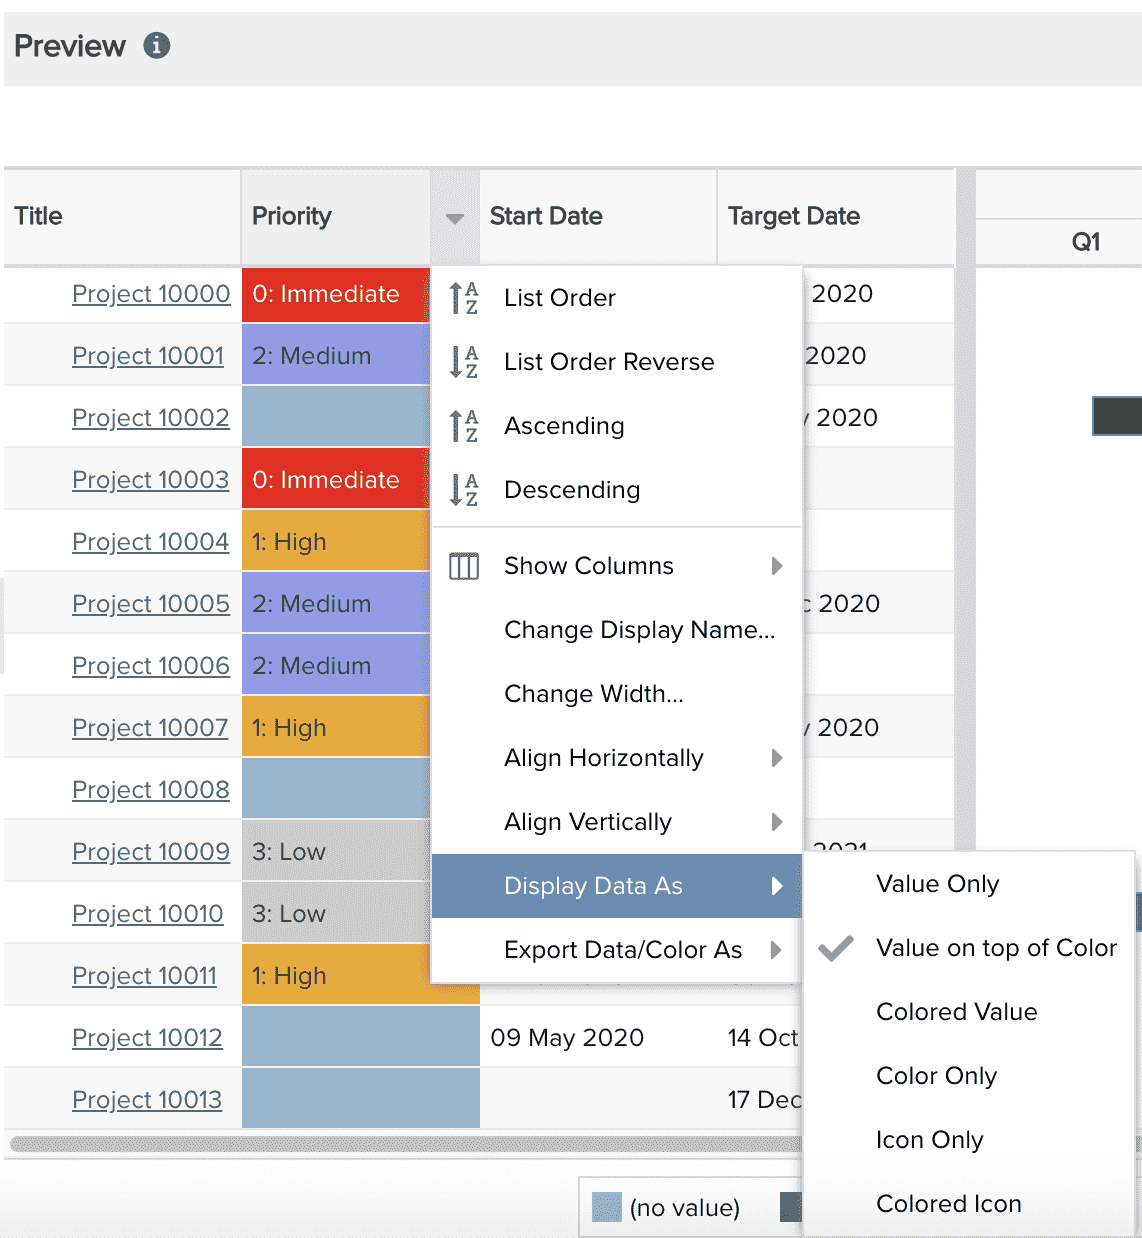
Configure desired options within the Display tab, such as Grouping, Sorting, Aggregation or Drilldown. For example, set the Title Drill Down option to Entity in order to allow your report viewers to click a project title to open that project in another tab. Within the Preview pane, select each column's options menu to set specific display options such as:
Within the Preview pane, select the Gantt "Color by" droplist option, for example, to color by Status (and hide that List column to save space). You can also select the gear icon to configure other Gantt settings, such as
If you want to use a field for a Gantt property and do not need it to show up in the List portion, add it to the List but then deselect the field on the "Show Columns" column property, so that the column is hidden in the rendered List. |
 |
| Variable Settings |
Scope: Organization, Portfolio Filters: optionally include project filters
|
Selecting the Organization and Portfolio Scopes will cause this report to be available on the Organization Report and Portfolio Report grids so it can be run per the organization or portfolio, respectively. As needed, you can also include Project Filters. If you want to allow the user to change to a different Scope and/or Filter before running the report or when viewing the report, select the relevant checkboxes for Allow changing. |