
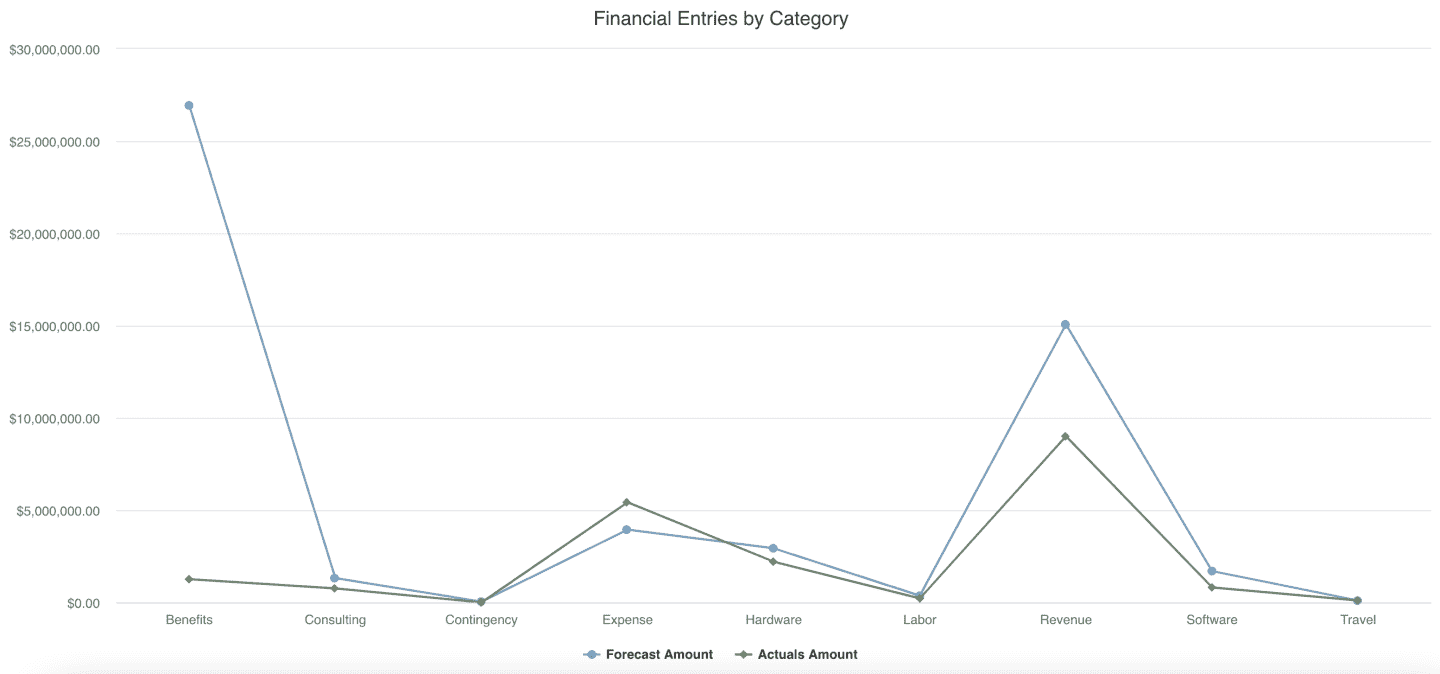
Financial Entries by Category
This report shows a comparison of forecasts and actuals by category across projects. For example, see a line chart showing total Forecast Amount and total Actuals Amount by Category, for all projects in a portfolio. You can build this report using the design settings in the table below. Alternatively, you can download this report definition and upload it to your PPM Pro instance.
| Design View | Selection | Comments |
|---|---|---|
| General |
Topic: Financial Entry Type: Line Title: <enter a meaningful title>
|
Other report Types that work well include Area: Basic, Bar: Basic, Column: Basic, and Spiderweb. If the selected data fields do not overlap, then the Area: Stacked, Bar: Stacked, and Column: Stacked may also be of interest. |
| Data |
Bottom Axis: Category (or other meaningful field) Left Axis: <up to 10 fields that do not have contoured data, such as Forecast Amount and Actuals Amount, and so on> |
|
| Display | Set desired Display options. | |
| Variable Settings |
Scope: Portfolio Filters: optionally include a financial entry filter
|
Selecting the Portfolio Scope will cause this report to be available on Portfolio Report grids so it can be run for associated portfolios. You can select other Scope options if you want this report to be show in other entity grids as well. As needed, you can also include Filters. If you want to allow the user to change to a different Scope and/or Filter before running the report or when viewing the report, select the relevant checkboxes for Allow changing. |