
Allocated Cost by Role
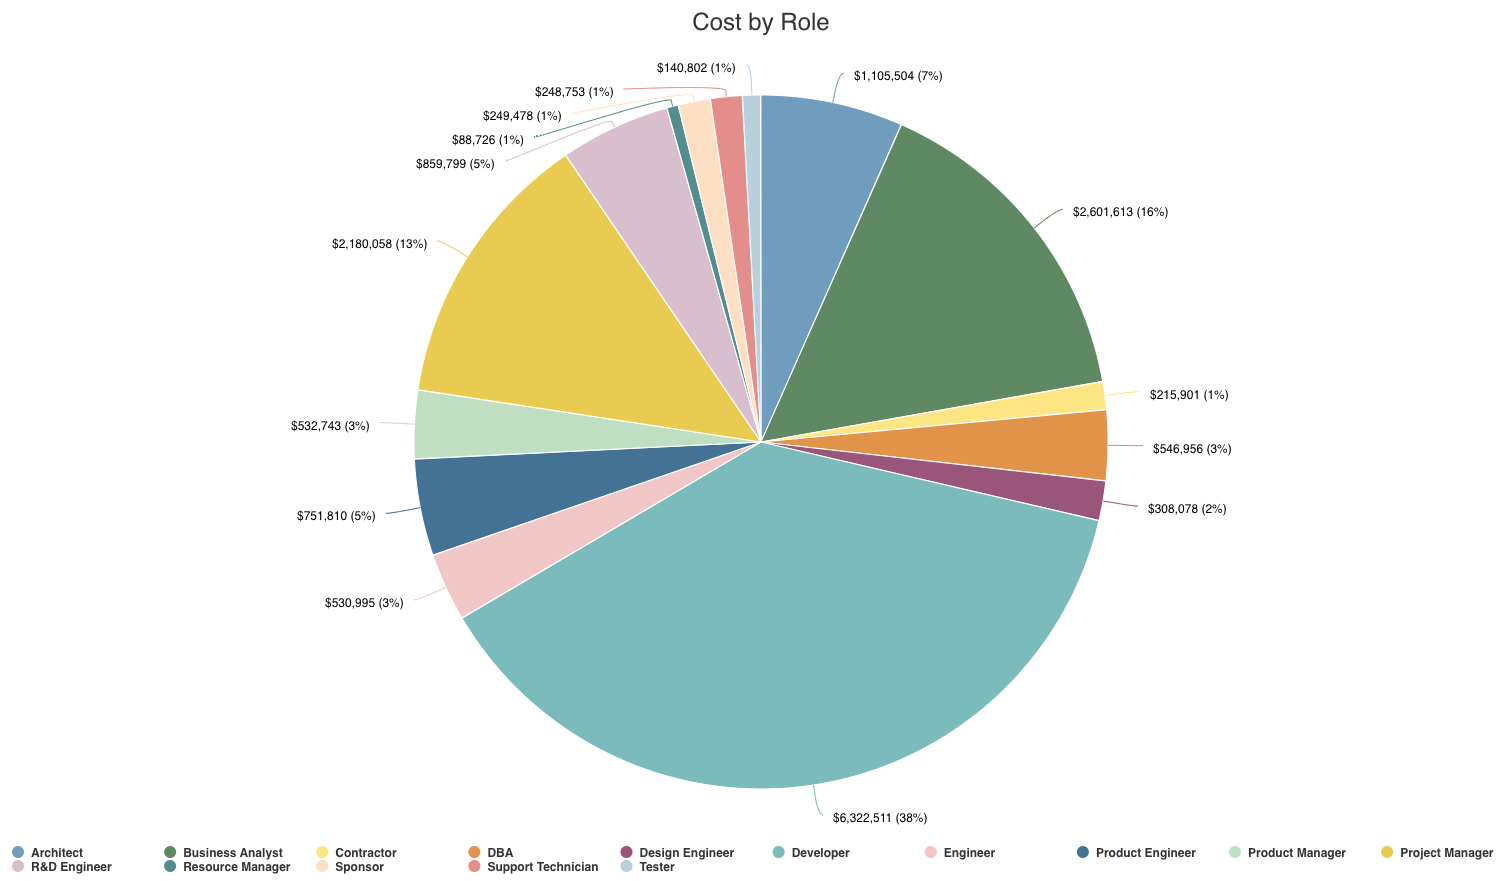
This report provides a visualization of the total allocated cost for each role, which is useful for reporting on role costs across the organization. For example, see a pie chart of the allocated costs across roles. You can build this report using the design settings in the table below. Alternatively, you can download this report definition and upload it to your PPM Pro instance.
| Design View | Selection | Comments |
|---|---|---|
| General |
Topic: Allocated Role Type: Pie: Basic Title: <enter a meaningful title>
|
Other report Types that work well include Bar: Basic, Column: Basic, and Donut.
|
| Data |
Group By: Role Values: Total Allocated Cost |
|
| Display |
Enter and select desired Display options, such as:
|
|
| Variable Settings |
Scope: Organization Filters: optionally include a resource or allocated role filter
|
Selecting the Organization Scope will cause this report to be available on the Organization Report grid so it can be run per the organization. As needed, you can also include Role or Allocated Role Filters. If you want to allow the user to change to a different Scope and/or Filter before running the report or when viewing the report, select the relevant checkboxes for Allow changing. |