Formatting List Reports
This topic describes how to use the Report Designer to format List reports - other report types use settings on the Display tab, but List reports are formatted differently, as will be explained below. You can also configure list reports to graphically reflect hierarchical data (portfolios, tasks, units).
See also Grouping and Sorting for List Reports, Gantt Reports and Creating Stacked List Reports.
Formatting the Report
You configure list report data right in the Preview pane. Once you add some fields to your list report definition and save, the report Preview pane will be visible from any tab (General, Data, Display, Variable Settings, Team). You can enter a Container Title for a list report on the Display tab, but all other configuration takes place in the Preview pane.
You can choose columns to display, drag columns to reorder and resize them, choose sort fields (up to 3), as well as configure specific settings to control max/min width, data wrapping, sorting, and alignment. In addition, there is an extensive menu of date formats, and the option to show/suppress decimals for float fields, and use textual representation of thousands (K) and millions (m).
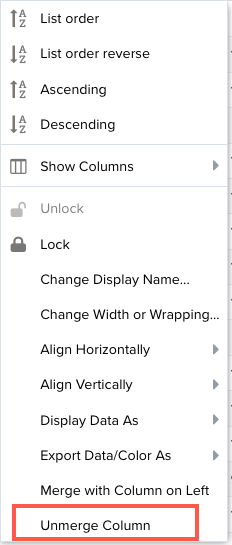
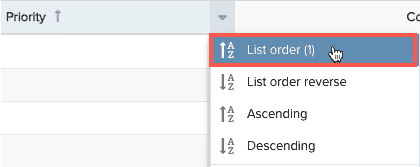
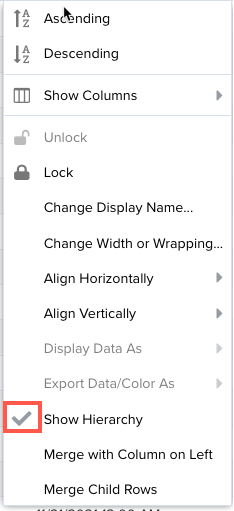
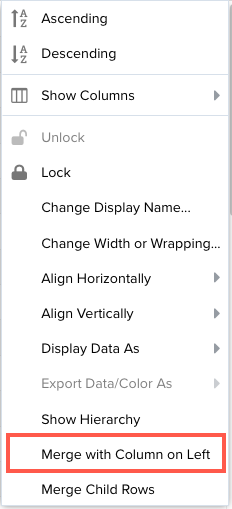
The configuration controls are located in the column header menus. Hover your cursor over the column header until the down arrow appears - click to display the menu, as shown below.
Each setting is described below.
Column Formatting
Sorting
- List order (available for Lookup List fields)
- List order reverse (available for Lookup List fields)
- Ascending - alphanumeric sort for text, string fields
- Descending - alphanumeric sort for text, string fields
You can click directly into any column header to pick a sort field - the priority is determined by the order in which you picked the field.
Alternatively, you can use the Sorting section (see screenshots below) in the Display tab to enter up to 5 sort fields and corresponding direction.
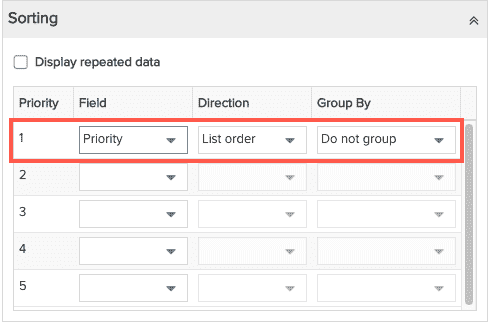
It's somewhat easier to select fields in the Sorting section when setting up multiple sort fields, because the Priority column clearly indicates the sort order. The priority of the sort field(s) is also shown next
Lookup List Sort Fields
Sorting by lookup list fields uses the sequence number of the list item by default - in other words, the sort goes in the order of the items in the list, and not alphanumerically.
Text and string fields are sorted by field value.
Showing/Hiding Columns
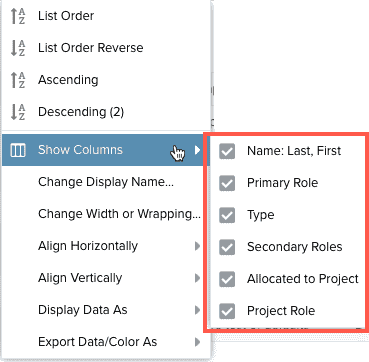
Open the Show Columns menu to display a submenu listing all the available columns included for the grid/report. Disable the checkbox next to any column you wish to hide in grid/list report.
If you want to add/delete columns, go to the Data tab and add or remove fields.
The rest of the column header menu items are described below.
| Menu Item | Description | ||
|---|---|---|---|
| Change Display Name |
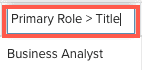
You can double-click into a column heading and edit its label, or you can select Change Display Name to explicitly make the column label editable, then delete or type over the existing name. This is what a header looks like after you double-click it or choose Change Display Name:
You can also edit all field labels using the Field Options dialog - see Changing Field Display Labels. |
||
|
To wrap column titles, see Wrapping column titles. |
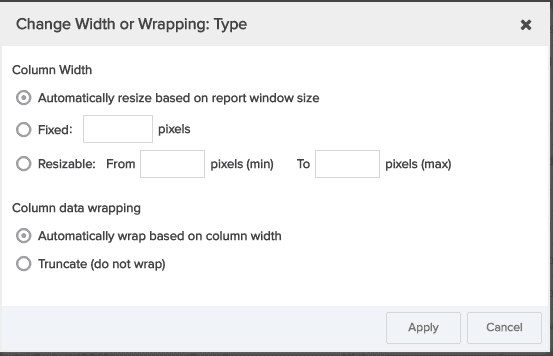
You can resize columns or you can impose limits on how a column can be resized and how wide the column can be when viewed, as well as whether or not the column data should be wrapped. Note that any changes you make in the preview pane will not persist on the rendered report. If you want specific settings to persist, they must be set in this dialog. Column Width settings:
Column data wrapping settings:
|
||
|
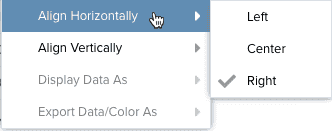
Align Horizontally
|
Justify column field data Left, Center, or Right. |
||
|
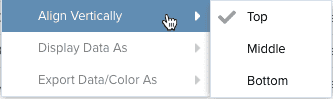
Align Vertically
|
Align column field data vertically Top, Middle, or Bottom | ||
|
|
Select Show Hierarchy on a column that contains hierarchical data to configure the report to display the parent/child relationships (show the indenting). For some examples, click the thumbnails below:
|
||
|
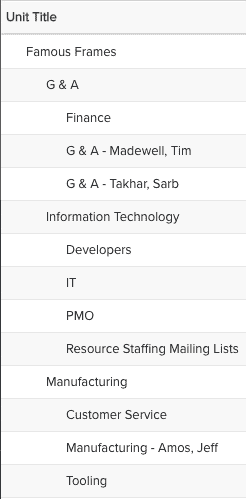
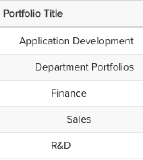
The Show Hierarchy setting is available on any list report that includes hierarchical entities (portfolios, tasks, units) in their field path. The entity might be a Topic, or it might come to the report by way of a related field path. Example hierarchical reports:
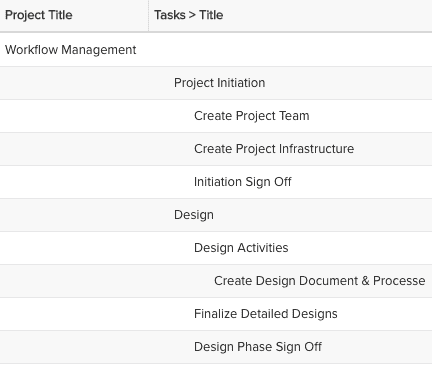
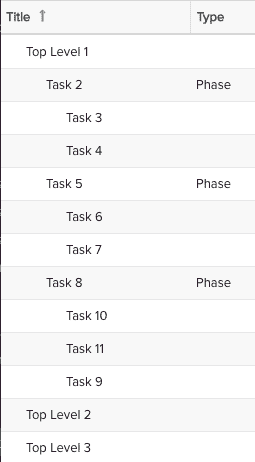
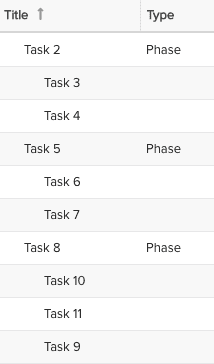
Filters You can use a filter to extract a subset of hierarchical data, sometimes referred to as an intermediate node. For example, imagine you have an unfiltered task report with Show Hierarchy enabled on the task Title - like the one to the right: Now we apply the filter "Task Type = Phase", and Show Hierarchy still selected for Task Title. You get a subset of the data starting with a task who matches the filter, and all its children, as shown to the right:
|
Show Hierarchy:
After applying a filter:
|
||
|
Merge with Column on Left
|
|||
|
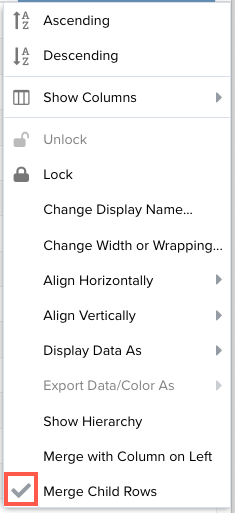
Merge Child Rows
|
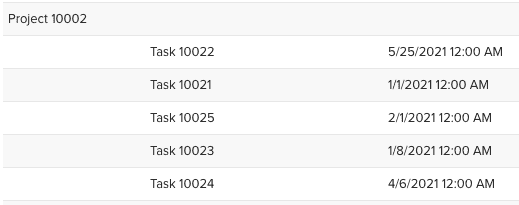
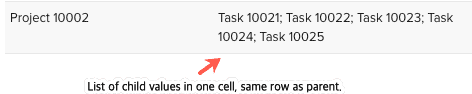
Merge Child Rows allows you to display data from different entities on the same row. The child data, initially displayed in one row per child starting on the row below the parent, will be displayed as a semi-colon separated list in one cell on the same row as the parent. For example, a simple list that show a project and the tasks that belong to that project. The first screenshot shows each task in a separate row, starting the row below the project. The screen-shot on the right is using Merge Child Rows, as a result the tasks are shown as a semi-colon delimited list in the cell on the same row as the parent project:
Using Merge Child Rows
|
 .
.