
Reports Overview
Welcome to the new PPM Pro reporting! This easy-to-use, robust report designer and engine allows you to quickly access your data and build meaningful reports, ensuring that what you pull out of PPM Pro shows the value of what you put in it. You can or will be able to sort, group, aggregate, and drill into your data (some of these still to be added) to produce a wide variety of report types (list, heatmap, line, spiderweb, donut, pie...to name a few) to meet the needs of your report consumers.
The report designer includes a Preview Pane that supports a real-time, iterative approach to building reports. Each time you make a change to your report definition, that change is reflected in real time in the Preview Pane using a small set of sample data. This constant feedback streamlines the report building process. When you want to see your own data, simply save and run. Note that the Preview Pane uses sample ("dummy") data for top-level entities (such as displaying Project 100001 for a project title) in order to offer the most performant experience. For data that likely won't affect performance, we use your actual data. For example, column data drawn from lists is using actual data because it is usually a small enough amount that it won't affect performance. If the field doesn't have a list behind it, we generate the data from scratch - lorem ipsom for text fields, random number generator for numeric fields. Dates are also randomly generated.
For users familiar with the legacy reporting system, take a look at Reporting - Then and Now for a comparison of legacy vs "new" reports, and Transitioning to New Reports for tips about recreating legacy reports in the new system.
Note: There will not be any migration from legacy reports to new reports. The two features are extremely different, and there really is no way to convert old into new. We have provided some instructional help - see Reports Cookbook, Reporting - Then and Now, Transitioning to New Reports, and Reports Overview.
About Related Data
PPM Pro reports can retrieve data from any entity that is directly or indirectly related to any topic (legacy reports support direct relationships only). To achieve this, the Data tab includes fields that take the form of “entity: field” that allow you to jump to different entities based on a related field – you can see these fields in the field path droplists (see Understanding the Field Path). An example of indirectly related data are resources and department owners - department owners are not properties of resources. An example of related entities are resources and units - every resource belongs to a unit. More explanation and examples to come in the documentation.
Getting Started
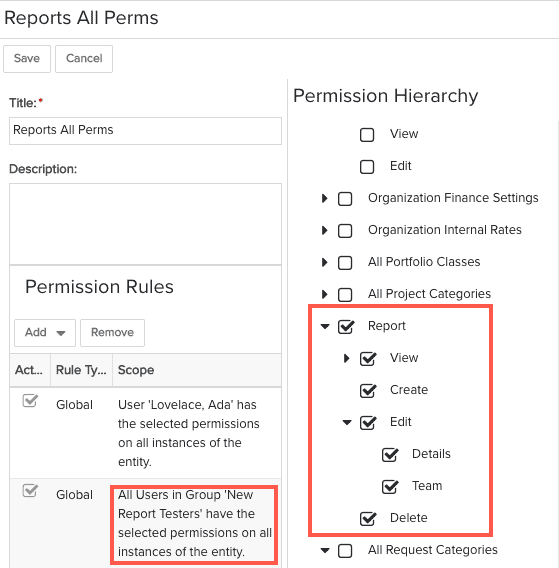
Note that your PPM Pro administrator will need to set up a permission profiles in order for users to see the Reports top-navigation link. The easiest thing to do is give global permissions to view/edit reports to all the users who will want reporting access. For example, you can create a group called Report Testers, and then give that group global rights to the feature, as shown below. Permissioned users will see a "Reports" link/icon, which is new reports, and a "Legacy Reports" link/icon, which is the legacy report feature:
Where to go First?
Configuring the report definition takes place in the "report designer". When you click the New button on the Reports List page, the designer opens in a new window/tab.
- When you create a new report, the report designer opens to the General tab.
- Click the Topic droplist to see a list of reportable "themes" that describe what the report is generally about: specific entities such as projects, tasks, issues, portfolios, and resources, or broader-themed and more complex reports that show time series data, portfolio-project relationships, audit history and KPI trends, and resource planning. Note that currently the broader themed/complex reports are not supported (and are not shown in the Topic droplist), these will be added in the future.
- Click the Type droplist to see a list of supported output types.
- To add fields to your report, go to the Data tab. See Understanding the Field Path, which describes how to add fields (including related fields) to your report.
- To add and format heading text - at multiple levels - as well as configure a legend (for relevant report types), go to the Display tab. Note that the Display options for List report types are different than the other types - you access the majority of the List report display options directly in the column header menus in preview pane.
- To give other users, groups, or units access to the report, see the Team tab.
For a detailed overview of the report designer, see Using the Report Designer.
Things to Keep in Mind
- Users must have some permission on a report to view the Reports top-level navigation icon/link.
- One output type per report.
- One report definition can run at multiple levels of the entity hierarchy.
- Report Designer opens in a new tab/window - don't forget to save before you close the window.
- Reports are always available at the top (Organization) Reports section.
- You can use Calculated fields in the new Reports, but only those of Entity Type "Standard Entity" that are set to be reportable.