
List reports
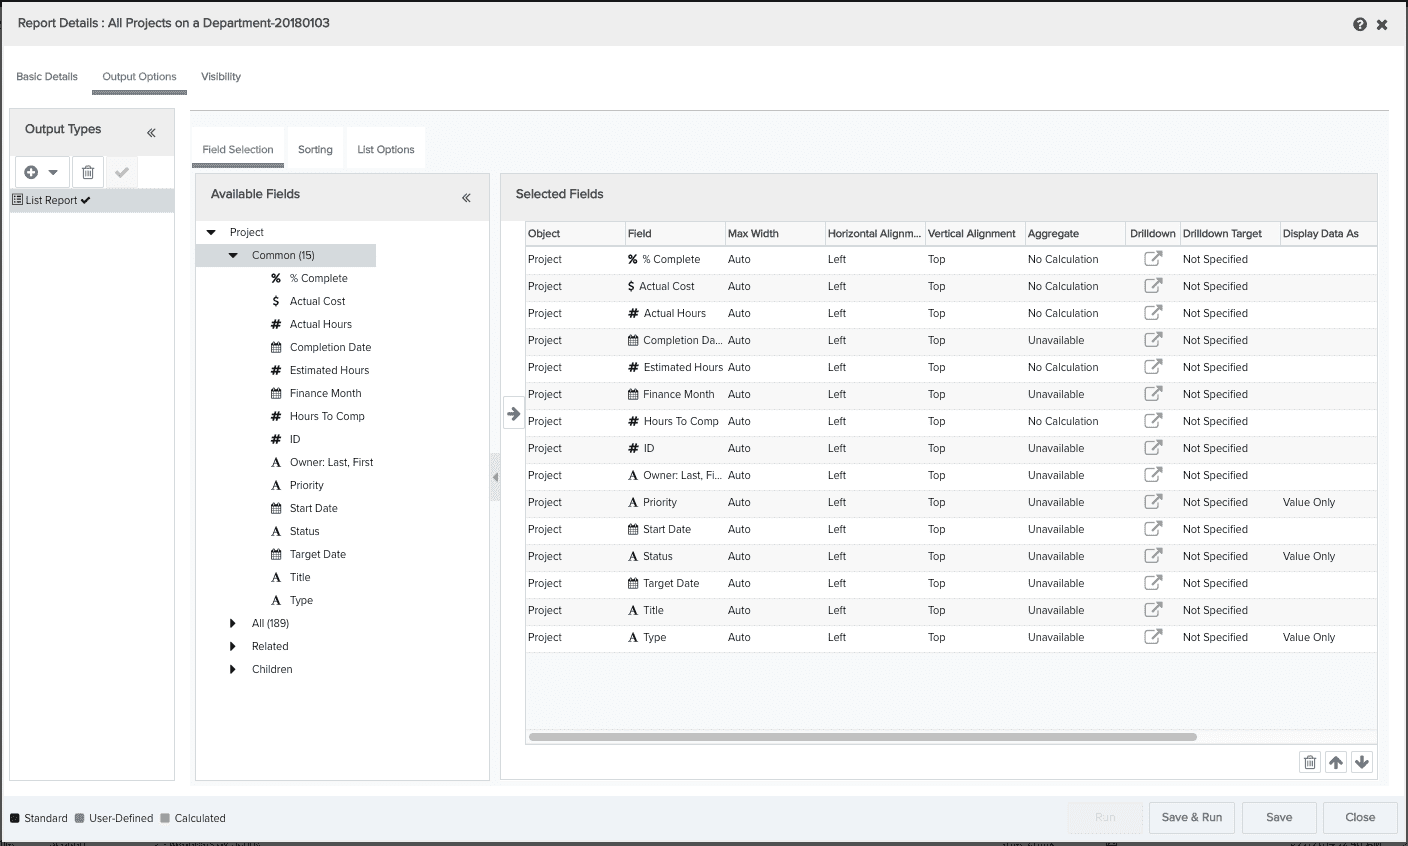
This topic describes how to configure the data for a List report. You will be working with a screen like the one below. At this point you will have already selected a report source, clicked New, and filled out a preliminary Basic Details screen.
You can perform the following on the Output Options/List Report screen:
Field Selection tab
-
select the data for your report and order it
-
change the field's display name
-
adjust the column width
-
configure a drilldown
-
specify summary fields
-
include calculated fields
-
hide columns
-
merge columns in a hierarchical report
Sorting tab
-
configure subtotals
-
create "break on" fields
Filters tab (only appears if you use a field from the Children folder for a hierarchical report)
- create filters for child elements
List Options tab
-
place subtotals at top of grouping (placement on bottom by default)
-
format the list into multiple columns (multi-column format)
-
print entity name in parentheses next to merged data (for hierarchical reports)
Select the data to be returned on the report
The Available Fields list shows all the categories of fields available for the report. These fields vary depending on the report source you are using.
To include fields in your report, locate them in the Available Fields list and drag them to Selected Fields table. If you include fields and then change your mind, simply select the field in Selected Fields table and click the Trash Can ![]() .
.
The table below describes the columns of the Selected Fields table:
|
Column Name |
Description |
|---|---|
|
Level |
(Only appears if you use a field from the Children folder for a hierarchical report) The numeric level of the field relative to the top-most entity. |
|
Parent |
(Only appears if you use a field from the Children folder for a hierarchical report) The name of the entity that is the parent to the child field. |
|
Object |
The name of the item/entity to which the field belongs. |
|
Field |
The name of the data field. This is the column name in the report. |
|
Display Name |
Allows you to enter a column name for the report that is different than the Field name. If this field is blank, the Field name is used for the column name. |
|
Merge |
(Only appears if you use a field from the Children folder for a hierarchical report) Combines columns that are on different levels. The second field will print in the same column as the first field, but indented to indicate the hierarchical relationship. You can only merge one column with its previous column, so you must be sure to order your fields correctly to get the desired effect. You can only merge fields that are on different levels. |
|
Max Width |
Allows you to modify the column width. Default is Auto, which allows the browser to adjust column widths according to content. |
|
Aggregate |
Perform a standard calculation: sum, min, max, avg, no calculation |
|
Drilldown |
Configure a drilldown for the field by clicking |
|
Drilldown Target |
Displays the target for the drilldown you specified in the drilldown column, either a report name or Entity. |
| Display Data As | (List fields only) Choose how the field value will be displayed. Specific values are configured on for the list on Admin/Setup/Lookup Lists. See Configuring Lookup Lists for more information. |
| Export Data Color | (List fields only) Choose how to treat the values if you export them to Excel. |
| Vertical Alignment | Choose whether to align the field values with the Top, Middle, or Bottom of the cell. |
| Horizontal Alignment | Choose whether to align the field values to the Left, Center, or Right of the cell. |
|
Hide |
Allows you to hide a field that you want to use only for sorting purposes. |
Order the data columns
After you add the fields to the Selected Fields table, you can reorder them by dragging them up or down or by clicking the up and down arrows at the bottom-right of the table. The order in which the fields appear in this table is the order in which they appear on the report.
Multi-column format
Note that if you use the Multi-column format, the fields are placed across the page, and then down. When you select the Display in Multi-Column Format option in the List Options tab, you must specify the number of column to use. For example, if you specify 3 columns, then the first 3 fields will print across the page, then fields 4-6 print in the second row, and so on. Keep this in mind when you are ordering the data fields.
Change the display name
By default, the name in the Field column of Selected Fields table is the column name in the report. If you want to change the column name, enter the name in the Display Name column.
Adjust the column width
By default the column width is set to Auto, which implies no maximum width. You can change specify a maximum column width, in pixels. For example, you can set the description field to 500 pixels. When the browser renders the list report, the column will not exceed 500 pixels. If there are few columns and the list report can fit comfortably in the browser window, the max width is also used as the default width. If there are too many columns or the browser window is too small, then the browser will automatically shrink the columns and the column width will be less than the max specified.
Align the fields
By default, fields area aligned to Left/Top. Use the Vertical Alignment and Horizontal Alignment fields to adjust.
Configure a drilldown
A drilldown is a link in the report output that the user clicks to display another report or the PPM Pro entity Info page, depending on how you configure the drilldown. You can create a drilldown link from most field types.
-
If the a drilldown is available for a field, you will see the drilldown icon:

-
If a drilldown has been configured to run a report, you will see this icon:

-
If a drilldown has been configured to an entity. you will see this icon:

Create summary fields
You create a summary field by applying the Sum, Average, Max, or Min function on a number field; these functions appear in the Aggregate column for all appropriate fields, including calculated fields.
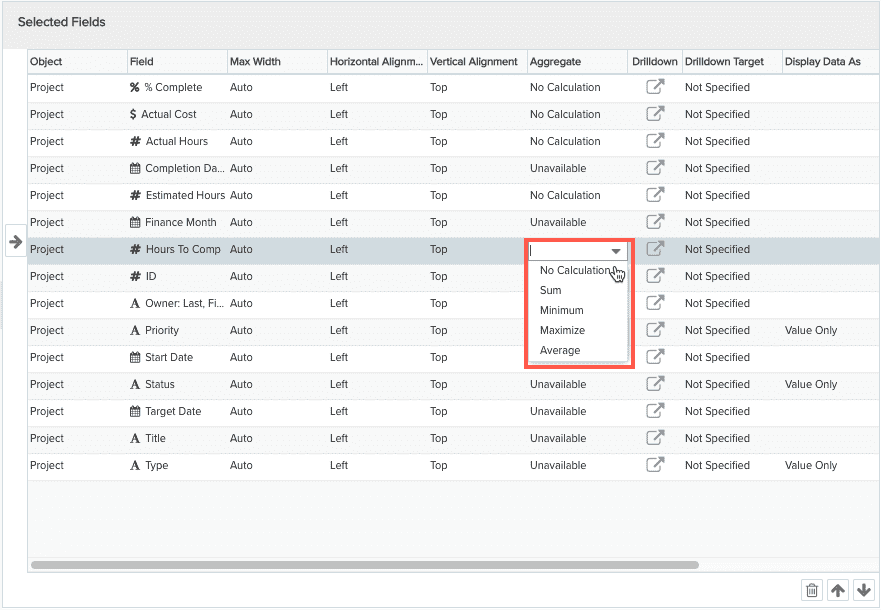
You use an aggregate function in conjunction with the Group By setting on the Sorting tab to configure subtotals and grand totals for summary and matrix reports. If you do not use the Group By setting, then you will simply have a grand total.
Hiding columns
You can include a field in a report to use for sorting purposes (by dragging it to the Selected Fields table) and then suppress its appearance in the report by enabling the Hide checkbox.
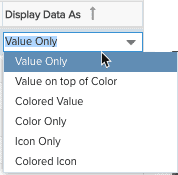
Configure the Visual Treatment of Lookup List Values
If you include list values in your report, you will have two additional fields to configure: Display Data As and Export Data/Color:
 and
and 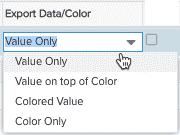
The admin who created the lookup list had the option to assign colors and icons. The Display Data As field offers a variety of presentation options. Your exact results will depend on how the lookup list was configured. Here are examples of each Display Data As selection:
| Value Only |  |
| Colored Value |  |
| Color Only |  |
| Icon Only | |
| Colored Icon | |
| Value on top of Color |  |
The Export Data/Color field determines how to treat the values if you export them to Excel. You cannot export icons to Excel, so the options are for value and color combinations.
For example, if your list value is configured for 'Colored Icon' for the report, and your Export Data/Color is configured for 'Value on Top of Color', you will get visuals like the following:
Colored Icon: ![]() vs. Exported Value on Top of Color:
vs. Exported Value on Top of Color: ![]()
Sorting tab
The Sorting tab is where you can further organize your list report by configuring sort fields. The Available Sort Fields list is the list of the fields that you selected for your report on the Field Selection tab. You can move sort fields to the Sort Fields table by dragging them or clicking the ![]() . To remove fields from the table, click select them and click the Delete icon (trash can).
. To remove fields from the table, click select them and click the Delete icon (trash can).
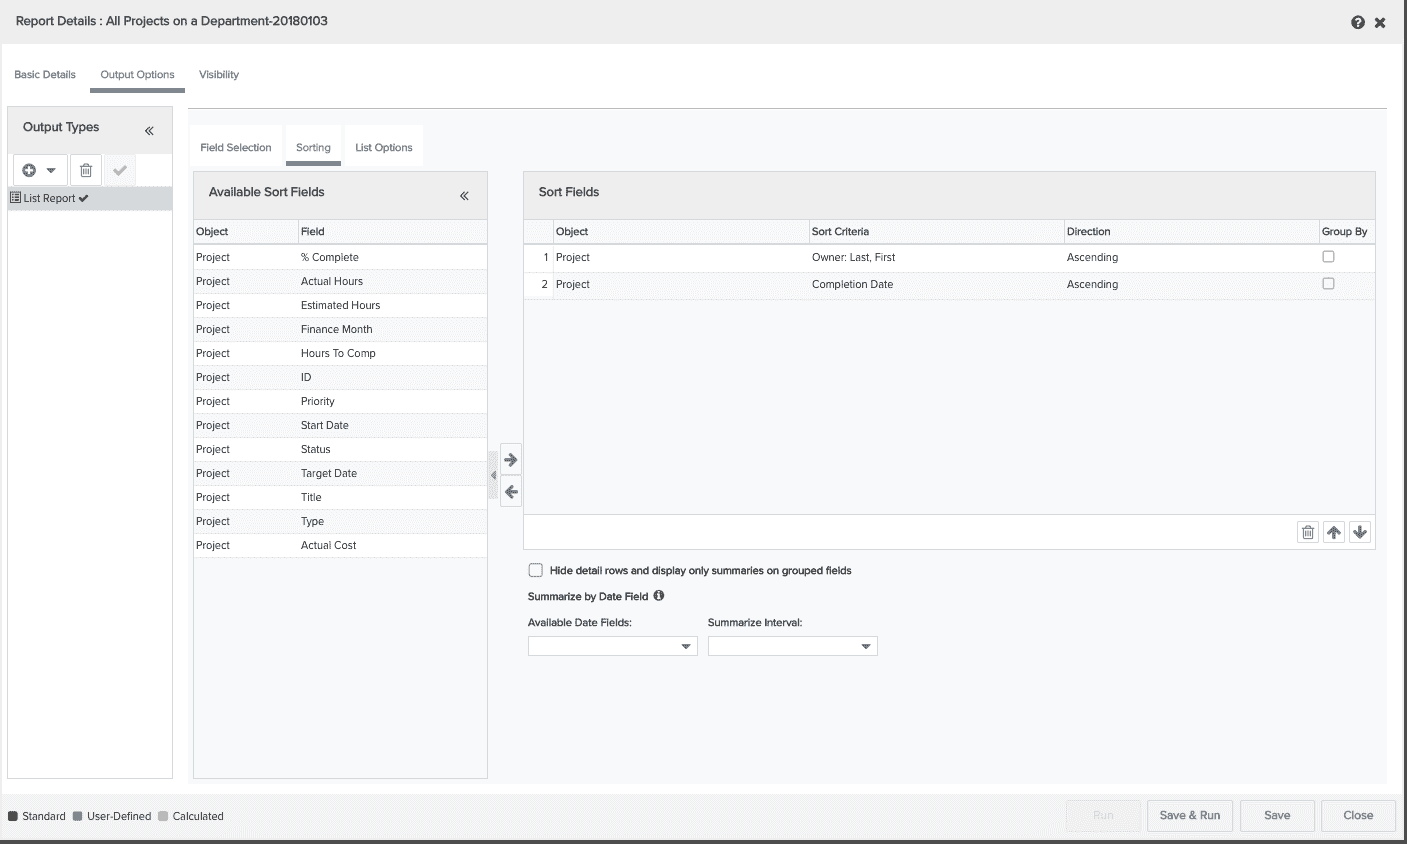
The table below describes the columns in the Sort Fields table:
|
Column Name |
Description |
|---|---|
|
# |
Indicates the priority of the sort field. In the screenshot about, the report will be sorted first by Project Type, then by Project Start Date, and then by Project Title. To change the priority, drag the fields up or down the list to change position. |
|
Object |
The name of the item/entity to which the field belongs. |
|
Sort Criteria |
The field that the report will be sorted on. |
|
Direction |
Determines the sort order: Ascending or Descending. If you are sorting on a lookup list, there are 2 additional options: Default and Default (Reverse Order). Default sorts according to the order of the values in the list. Default (Reverse Order) sorts in the reverse order of the values in the list. |
|
Group By |
Used in conjunction with aggregate fields. Group By indicates where/when the data will be summed. Also used in conjunction with Date fields to create "break" reports. |
Creating subtotals
To create subtotals, you use aggregate fields in conjunction with the Group By property. For example, in the screenshot above the Group By field is Type. This means that the aggregate fields specified on the Field Selection table will be sub-totaled at the end of each Project Type section of the report. If you want to suppress the individual detail rows and print only the subtotals, see Hide details below.
Hide details
If you have configured subtotals, you have the option to display only the subtotal by enabling Hide details rows and display only summaries on grouped fields. This setting will display the subtotal values only, without the detailed entries that comprise the subtotal value.
Break the report out by a date field and time period
If you have included a date field in your report, you can use that field to create additional subtotals by configuring the report to print a subtotal at a daily, weekly, monthly, quarterly, or yearly interval. Note that the field you choose to summarize must also be configured as a Group By field

What next?
You can edit the sort order and create subtotals, list options, save and run your list report, change the default visibility, or configure other output types: