Using the Dashboard Designer
This training video will provide an overview of the dashboard designer. The dashboard designer is where you create and edit dashboards. It’s as simple as selecting reports to include, drag and drop to position and size, run, and test – all with the help of the WYSIWYG Preview Pane. Duration 6 min.
The dashboard designer is where you create and edit dashboards by providing a dashboard Title, selecting the reports to include, dragging and dropping to position and size the reports, running, testing, and iterating until you get the dashboard you want. The WYSIWYG Preview Pane speeds this process along, so by all means, use a trial and error approach, it's better than a tome of documentation!
The dashboard designer opens in a new browser tab when you create a new dashboard (click New on the Dashboard list), or edit or copy an existing dashboard; it consists of a Toolbar, a Design area, and Preview pane, and a Variable Settings modal for each report on the dashboard.
Overview
Toolbar
The dashboard designer toolbar has a few key functions to be aware of and which will make your life easier:
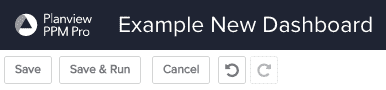
- Save - Saves your new dashboard or all the changes since the last save.
- Save & Run - Saves a new dashboard or all the changes since the last save and also opens the actual dashboard in a new tab. Running the dashboard allows you to see exactly how the dashboard will appear to your viewers with actual data. Although the Preview area described below is also intended to show you what your viewers will see, it will display sample and not actual data in order to optimize design display performance.
- Cancel - Discards all changes since the last save. If you want to cancel creation of a new dashboard and have not yet saved, then you will need to close the dashboard designer tab.
- Undo - Incrementally reverts each change you have made, from most recent to less recent, up until you last saved. This is represented by the counter-clockwise circular arrow icon button.
- Redo - Incrementally recreates each change you have recently undone, from most recent to less recent, up until you last saved. This is represented by the clockwise circular arrow icon button.
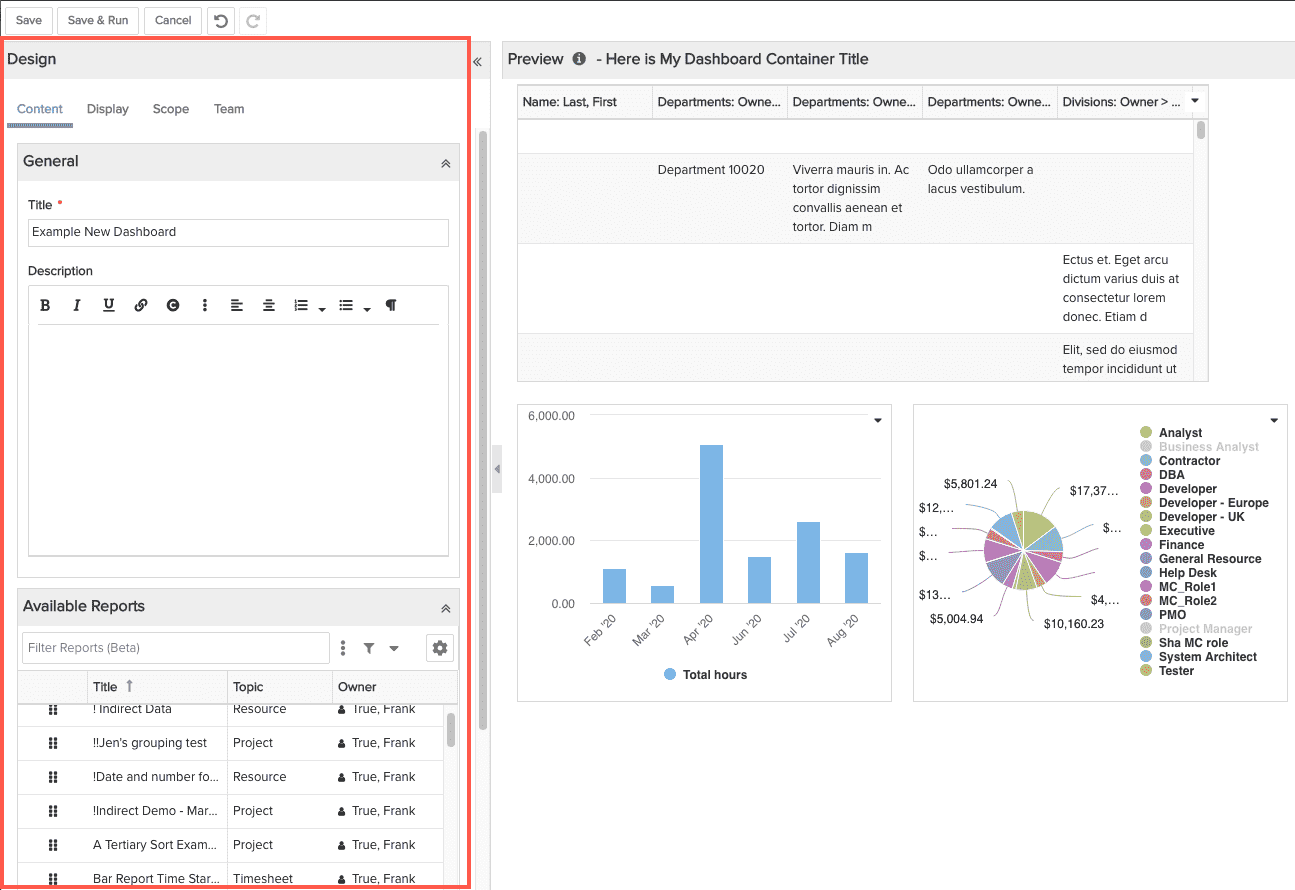
Design Area
The design area is the left section of the dashboard designer. It can be collapsed, expanded, and resized to accommodate your needs. Its tabbed sections allow you to enter and select various design options that impact to whom, how, and where your dashboard will appear:
- Content - Provide a name for the dashboard (used in the various dashboard grids to identify the dashboard, not the dashboard Title) and select the reports to include in the dashboard. Optionally enter a dashboard Description.
- Display - (Optional) Enter text for the dashboard container heading; option to include at the bottom of the dashboard a record of who the dashboard was last run by and when.
- Scope - Choose which entity dashboard grids the dashboard can be accessed on, and whether to allow the dashboard consumer to change the scope. Scope defines the data set on which to run the dashboard. The beauty of scopes is they allow you to reuse reports and dashboards by letting the user run them on different data sets, or scopes. No need to create different versions of the dashboards, just "launch" them over a different set of entities.
- Team - Add user/group/unit with a permission profile that controls whether they can view, edit, and/or delete that dashboard.
Preview Pane
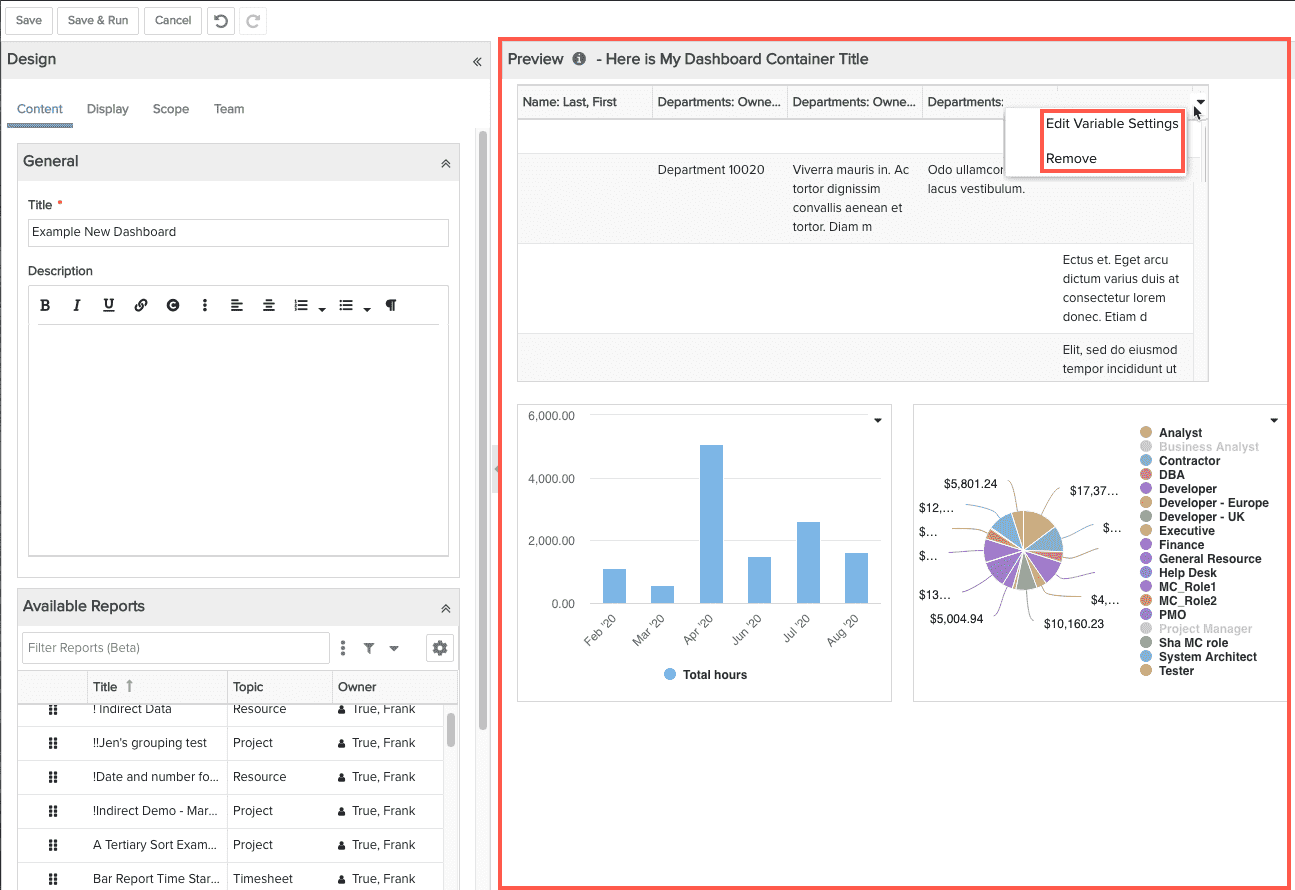
The Preview pane is the right-hand section of the dashboard designer. It can be resized to accommodate your needs. As you design your dashboard (throw on a few reports), it automatically updates to show the impact of your selections. You can drag and drop to reposition report components. You can also resize a report by hovering over it and clicking on either of the two bottom arrow icons or corners and dragging to resize. Note that the variable settings can be configured for each report on the dashboard - there is a menu at the top-right of each component that includes the Edit Variable Settings option. See Variable Settings for more information. This Component menu also allows you to Remove a report if you no longer want it on the dashboard.
The Preview pane uses sample data so that it is snappy and responsive, enabling you to quickly see the implications of your design choices. Note that dashboards can be configured to allow dashboard consumers to change scope when viewing (not before running); if you want to see how your report will look with actual data, simply click the toolbar Save & Run button and your dashboard will open in a new tab. If you configure the dashboard to allow changing scope, you can test out the dashboard in different contexts.