Tasks
Overview
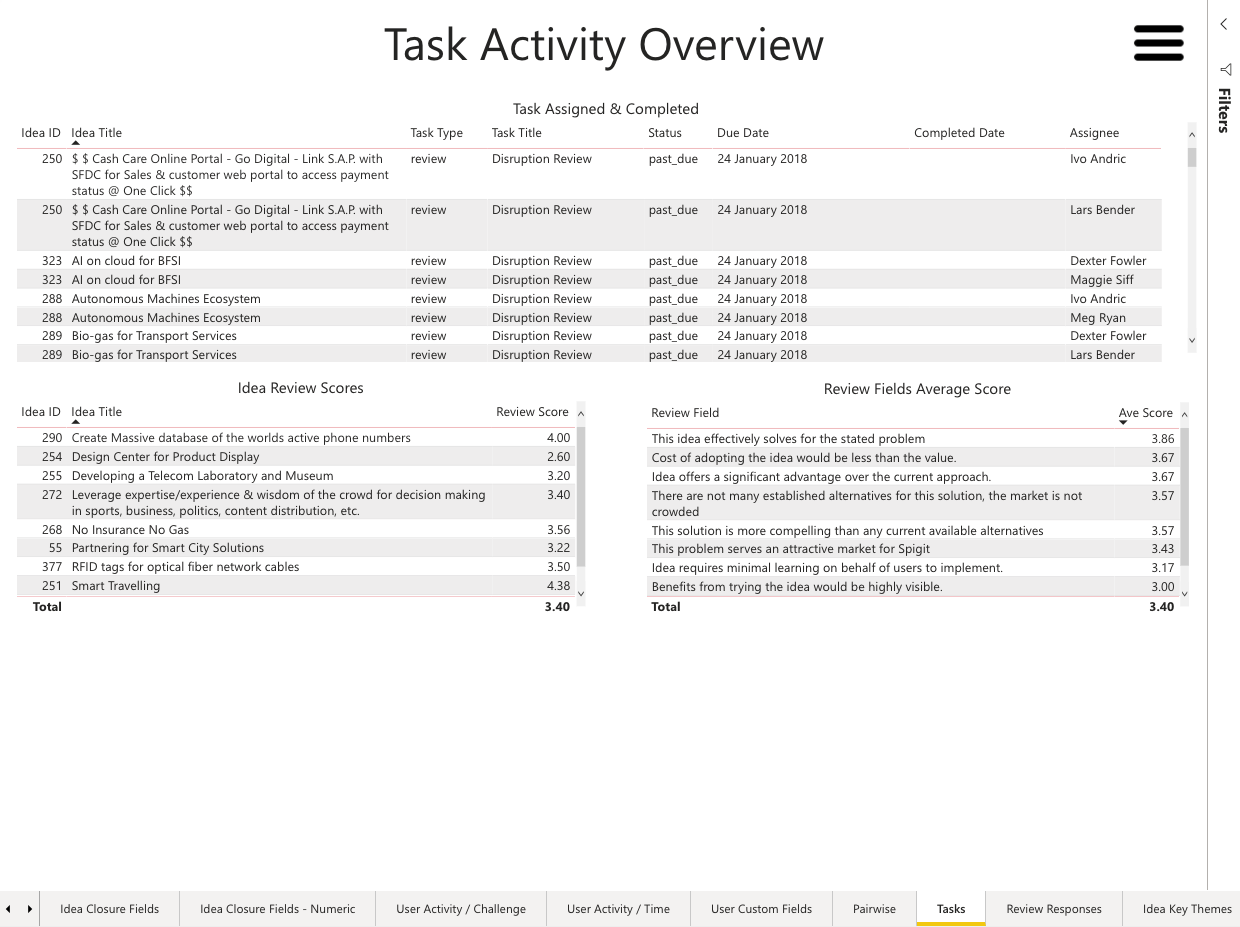
In this Insights feature, the Task tab is split into three visualizations.
In this Insights feature, the Task tab is split into three visualizations.

Tasks Report example
This visualization shows the breakdown of individual tasks that are assigned to ideas within the chosen challenge or community. The table includes Idea ID, Idea Title, Task Type (review, evaluation, approval, etc.), Task Title, Status, Due Date, Completed Date, Assignee (user who was assigned/completed the task when the data was run), where appropriate.
The visualization shows a simple breakdown of reviews and ideas only. This isolates the quantitative reviews and populates the table with their total review scores (which includes any weightings). The table contains Idea ID, Idea Title, and Review Score.
This visualization demonstrates the average score obtained for each of the review fields that are present in the challenge. This illustrates a high level view of strengths and weaknesses associated with the different quantitative fields in the review forms. The table contains Review Field Title and Average Score (obtained for all ideas where the field was completed).

