
All Data Clusters
In this set of visualizations, you can automatically model Ideas, Taps, and Tap Responses together. The central visualization offers a word cloud of key phrases which are generated from these three data sources and then refined by the last 90 days on a rolling basis.
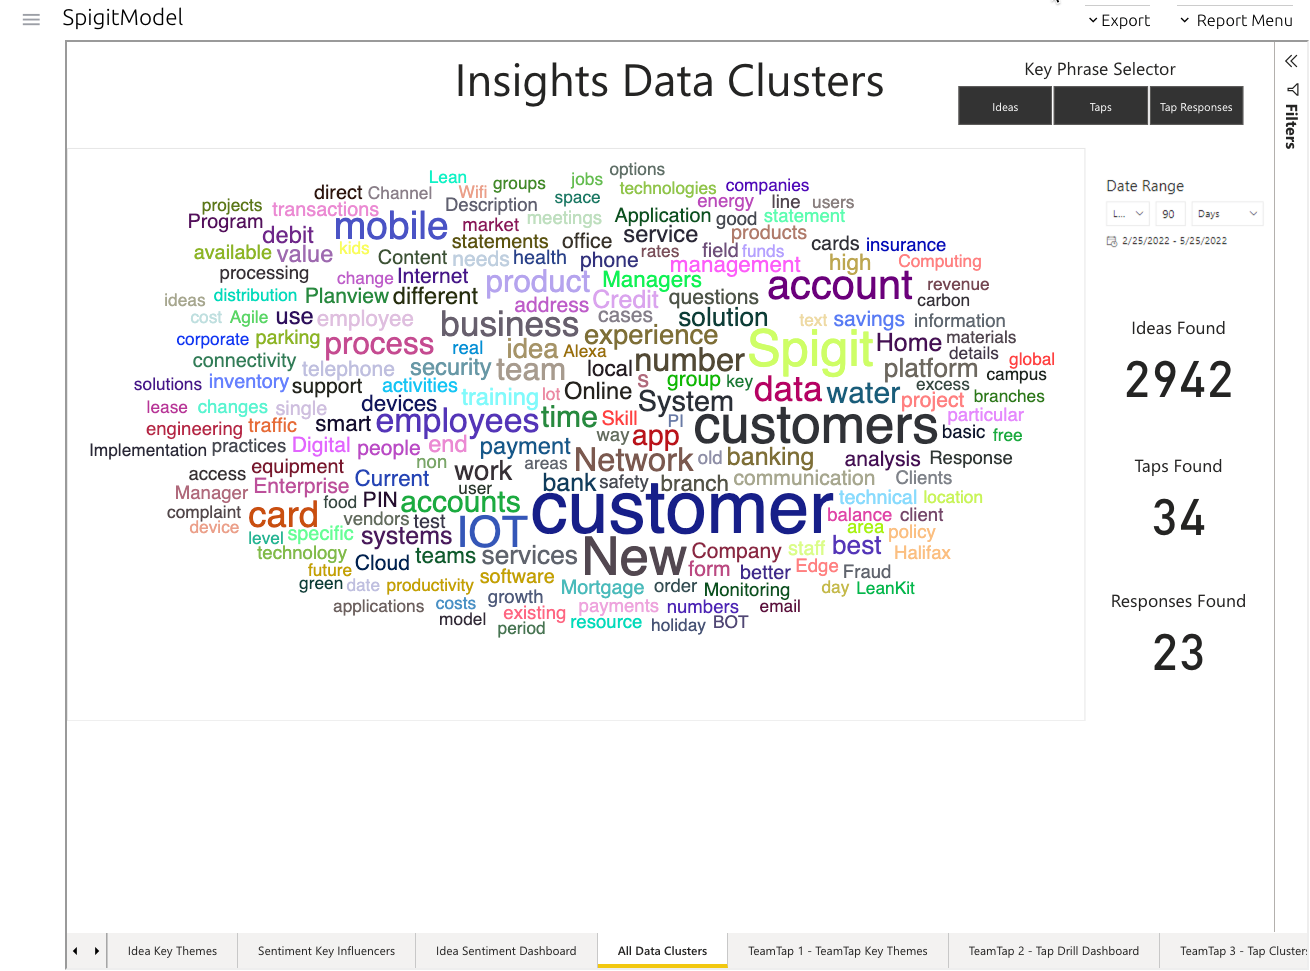
Figure 1 - All Data Clustered into the main visual
The buttons allow for the configuration of the core visualization, which can remove each element from the word cloud.
The counts that are visible on the right side will show the matches when a particular cluster is clicked. This helps a user to understand where the cluster is emerging from within the data model.
Each count offers a drill through list of Ideas, Taps, and Tap Responses, which corresponds with the selected cluster. Simply select a cluster and then right click on the count:

Figure 2 - Drill through access point following a right click
This takes the user to a predefined table page where the listing can be exported to .csv format by using the standard Power BI options. These tabs are labeled Tap Drill Through, Tap Response Drill Through and Idea Drill Through. They are always visible at the far right of the navigation ribbon in the SpigitModel.
TeamTap-specific analytics are listed below:
TeamTap2 - Tap Drill Dashboard
TeamTap4 - User Activity Breakdown
TeamTap5a - Tap Explorer Activity