Report Details
The page displays the idea title in the header, the description, owner, current stage, and date created in the upper part of the tab. Then, depending upon your configuration, the other visualizations will display core metrics around the selected idea. We have included a breakdown of the visualizations below:
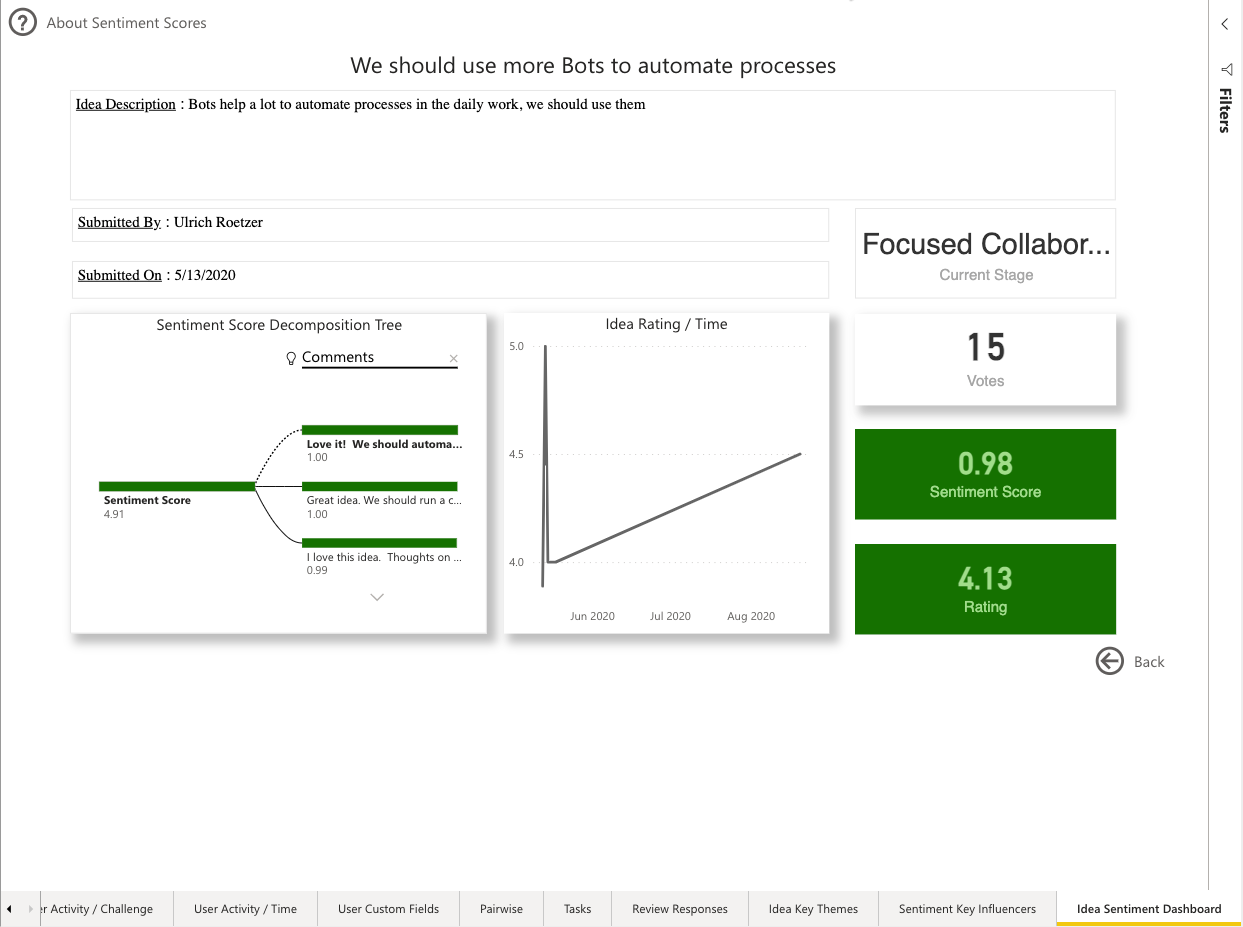
Sentiment Score Decomposition Tree
The cumulative sentiment score for the idea is listed on the left tree branch. This is compiled by scoring each comment within the idea for sentiment (positivity). Clicking the branch will open the tree, displaying each comment and its corresponding sentiment score. Hovering over the comment will display the full text along with the score. The tree branches are scrollable so that all comments can be viewed here.
Idea Rating/Time
If star rating is in use, the visualization displays the track of rating over time. This clarifies how the idea may have experienced fluctuations in the ratings being provided by the crowd. Aligning this with sentiment provides insight into how the crowd are reacting by rating (core metric) and through sentiment which is a more subjective measure of reaction by the crowd. Importantly, sentiment is the expression of support without voting and therefore offers a new way to track support from those users that do not rate or vote on ideas.
Votes
This tracks the number of ratings or votes cast on the idea that is being viewed.
Sentiment Score
This is the average sentiment score for the idea. It is conditionally formatted to provide a visual indicator of sentiment health. Red rating will track sentiment from 0 - 0.5. Amber will track sentiment from 0.51 – 0.74 and Green will track sentiment from 0.75 – 1.0.
Rating
This tracks the current star rating for an idea based upon ratings cast. This is also conditionally formatted. Red will show if the idea is below 3.0 and Green will show for 3.0 and above.