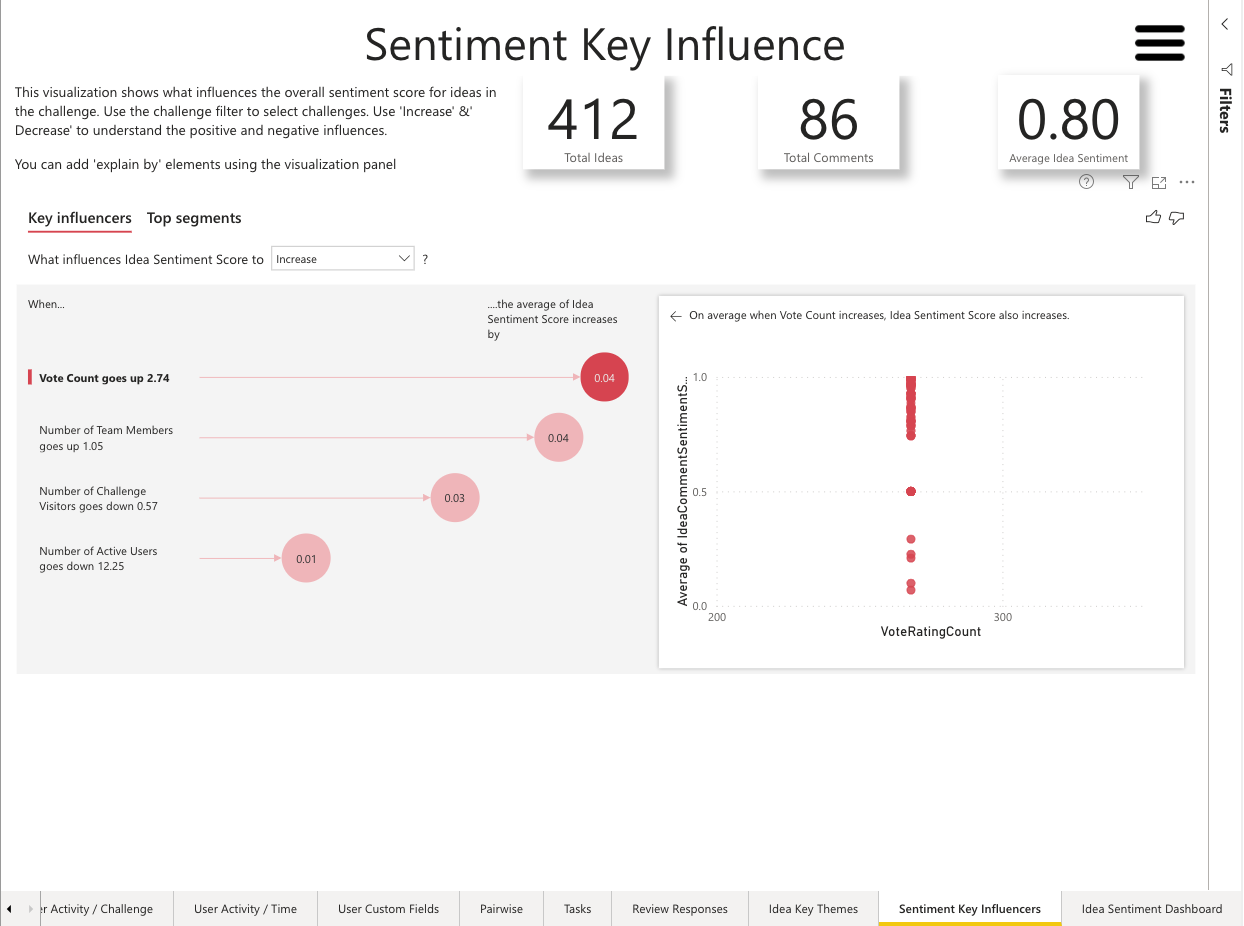
This visualization shows what influences the overall sentiment score for ideas in the challenge. Use the challenge filter to select challenges. Use Increase & Decrease to understand the positive and negative influences.
The sentiment is derived from a Power BI capability which is described here. The visualization is designed to show you how sentiment is influenced in each challenge. This influence is described using key metrics and metadata that may be present in your challenge.
Sentiment Key Influencers Report example
Business Outcomes
Coming soon
Supporting Capabilities
Coming soon
Report Details
The visualization is explained by:
Number of Challenge Visitors
Number of Active Users
Comment Count
Vote Count
Idea Views
Number of Pairwise Voters
Number of Team Members
Specified Audience Size
The list above represents the default explanation metrics. The sentiment will use those metrics to explain what happens if any one of them impacts the sentiment that is expressed and scored within the challenge.
Any other metric or count can be added to the visualization. Please remember to copy the visualization to a custom report to prevent any changes from being overwritten by system maintenance.