
TeamTap5a - Tap Explorer Activity
Moving deeper into the confluence of activity and user data, we are using a new "cord" type visualization, which is a great way to demonstrate the count and type of activity when linked with user attributes.
The User Attribute Selection will populate with any user attribute that is sent to IdeaPlace. These can include Location, Country, Department, etc. These attributes will always populate on the left side of the cord, mapping in size (to denote levels of activity) against the activity types on the right side.
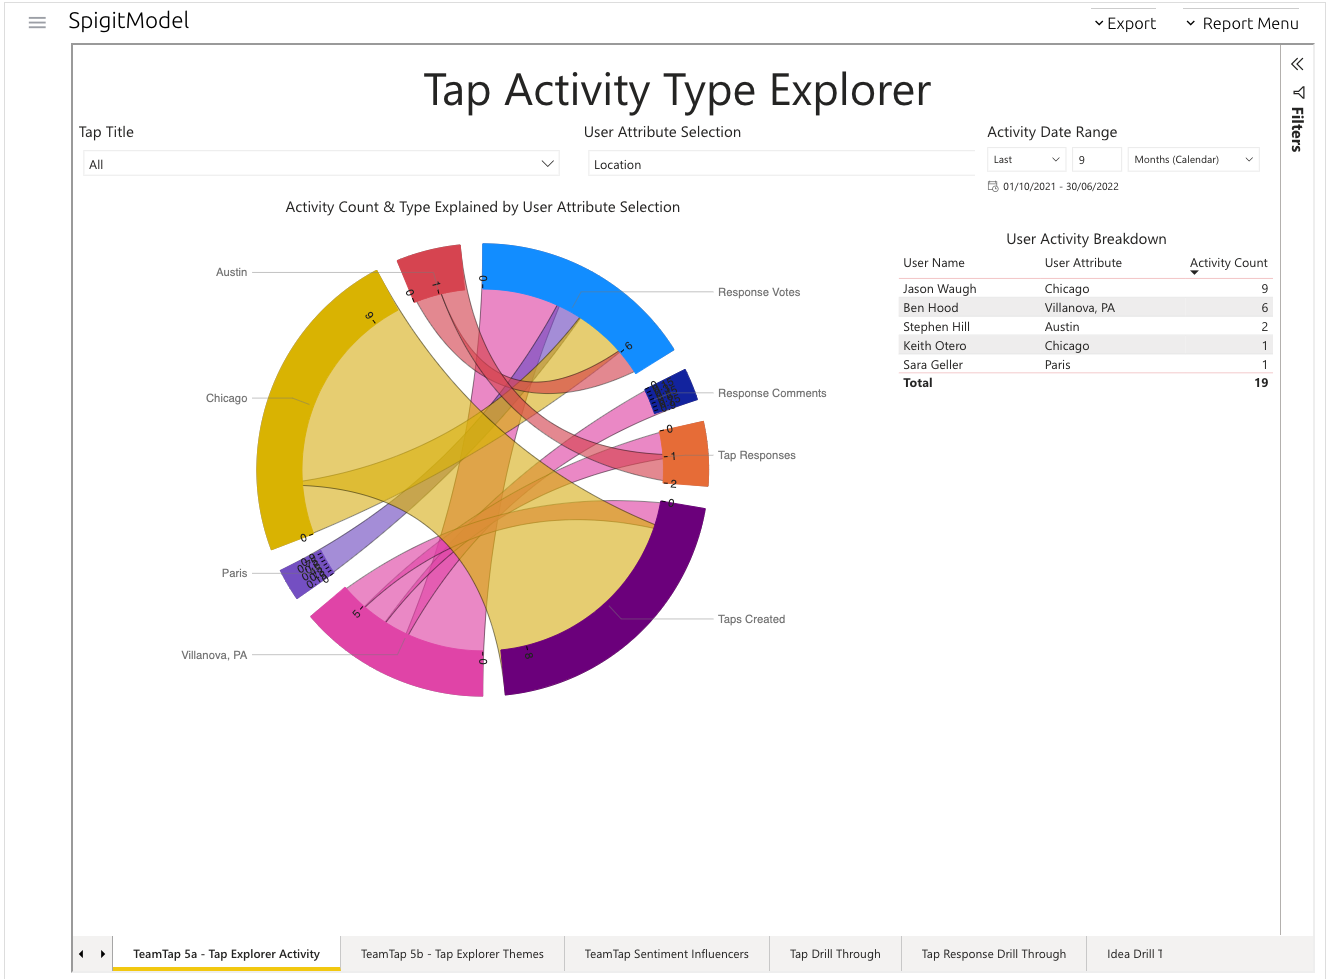
Figure 1 – New chord visualization to demonstrate activity
This is an excellent way to represent a track of different user attributes and visualize how they drive levels and types of activity over time. The right side of the tab shows a tabular breakdown of the users that match the configurations in the cord. This can be exported to .csv format.