Planview Customer Success Center

User Activity / Time

Overview

This re-designed visualization uses the ideaID and the posting timestamp of the idea to determine activity by users across a temporal filter. The visualization uses a cumulative approach to activity, showcasing which users have been the most active over a period.


User Activity by Time.png

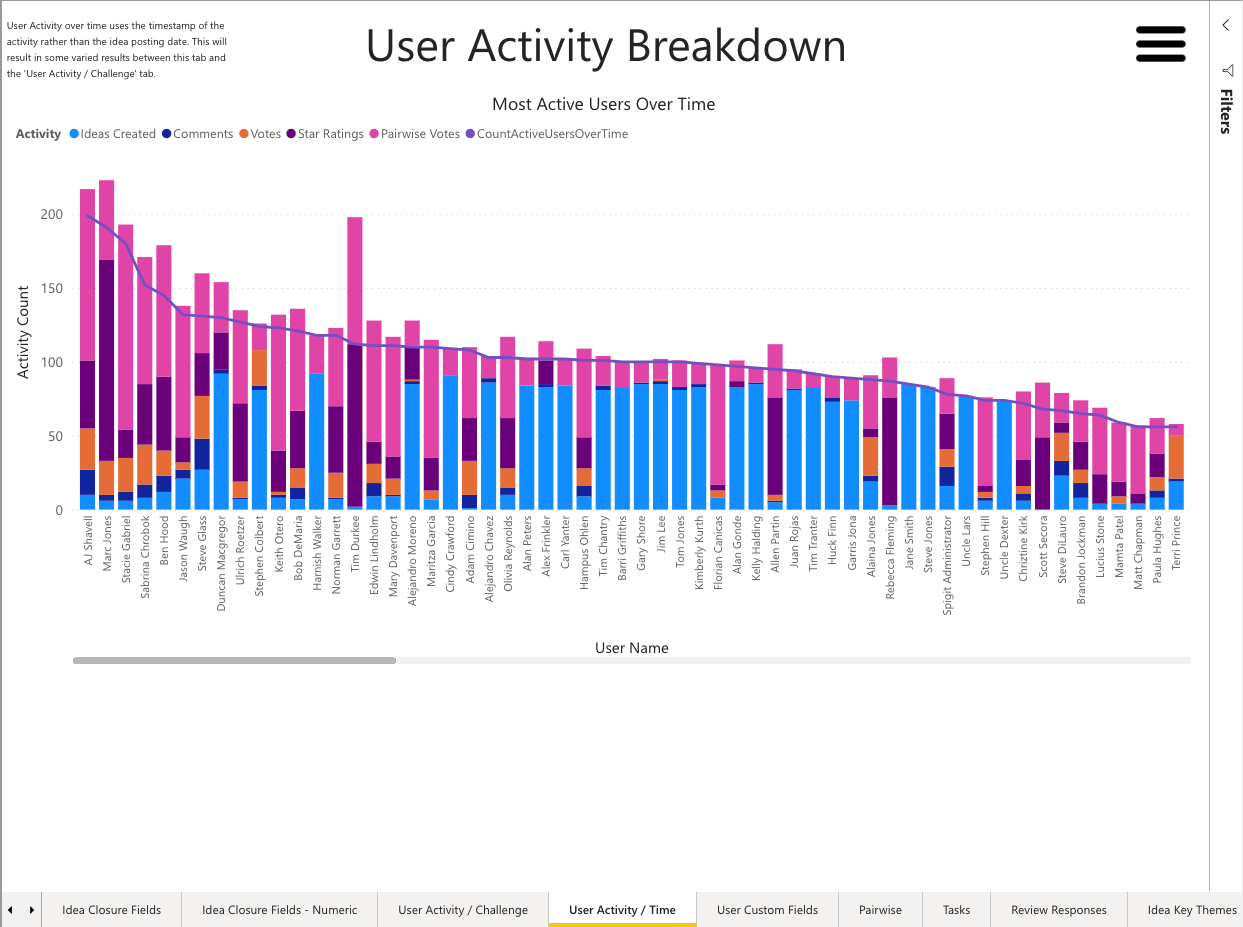
User Activity / Time Report example


Business Outcomes

  • Coming soon


Supporting Capabilities

  • Coming soon


Report Details

In this visualization, the activity is linked to an idea. For example, if a user comments seven times upon a single idea, it will count once rather than seven times.