
Accessing Planview IdeaPlace data in Microsoft Excel
Planview IdeaPlace Excel Connector
Introduction
Since the rollout of the Power BI Embedded and OData capabilities in 2020, we have been able to offer a richer analytics and reporting experience that is tied more to the tools you are familiar with away from Planview IdeaPlace. With the release of the IdeaPlace to Excel connector, we are offering yet more connectivity to these tools.
Working with the Connector
In order to use the connector, a user must have access to the Insights page within the IdeaPlace application. The access controls visibility of the Export menu which is available within the Power BI Embedded menu. This means that a user must hold the Super Administration or Report Creator role in order to access the panel by default.
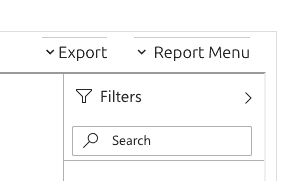
Figure 1 - Export menu visible in the Power BI frame
From the export menu, you should select the Excel ODC File option which will be the starting point of the file generation and connection flow. The purpose of the file is to connect you to the SpigitModel that you access inside of Power BI Embedded.
Upon clicking this, your browser will inform you (Figure 2) that the file is being prepared for download. Click OK to acknowledge the message and begin the download process.
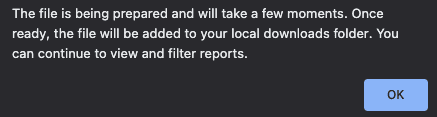
Figure 2 - Browser notification
Once the file is ready, it will automatically download onto your local downloads folder (whichever you have as default) and you will see a confirmation per Figure 3 below.
Figure 3 - Download Confirmation
The ODC file will now be available on your local file store and can be opened using your Microsoft Excel application.
NOTE
This format will only work on a Windows machine and is not compatible with MacOS.
Locate the file and open it using your Excel Application. This will open the file and automatically present the PivotTable feature within Excel (Figure 4)
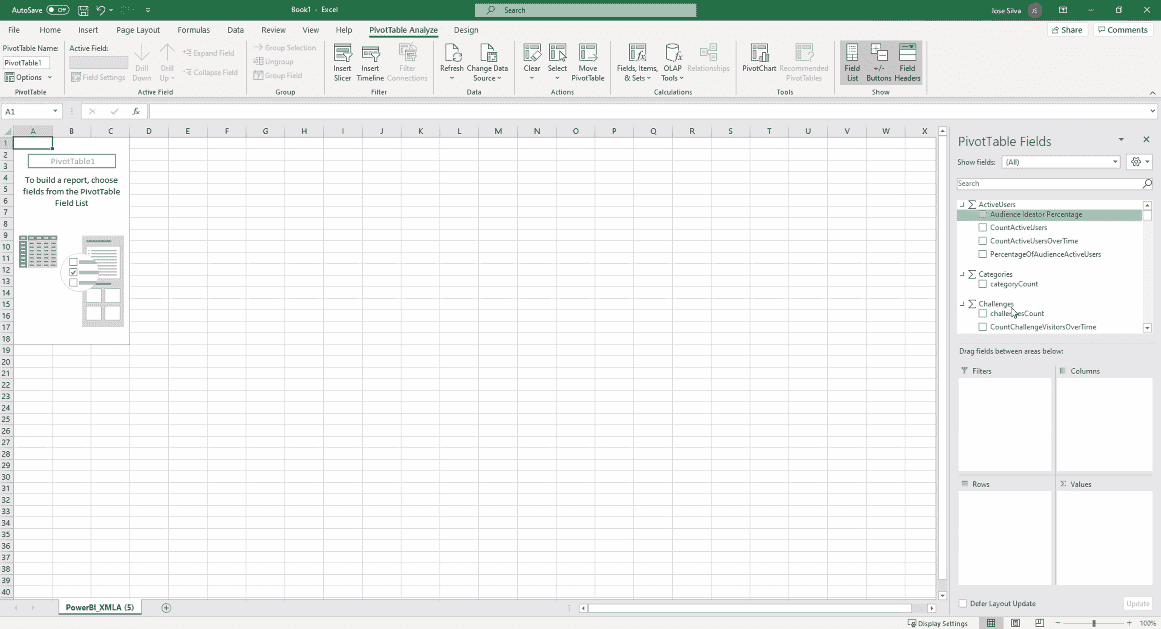
Figure 4 - ODC file opened within Excel
Now that the file is open, the connection between your application and the SpigitModel is live. This means that all data points and measures are now available in the PivotTable Fields section on the right panel. Users that are familiar with the pivot functionality of Excel can now use the connection to build custom pivots and save them for reporting purposes.
Pre Build - Important Considerations
Before you commence with building the pivots, it’s important to follow two key steps that will improve the performance of the application. Each data model contains a large amount of data, so you will notice that it takes a little time to run the table builds. To help mitigate some of the performance, leverage the following steps:
- Filter the data using the Filters section of the PivotTable panel.
- Check the Defer Layout Update box at the bottom of the PivotTable.
After those steps have been completed, a report can be built using the PivotTable functionality. This will permit any of the measures and data attributes to be combined into a report. Slicers and filters can be applied to allow a more customizable report to be constructed.
NOTE
You must uncheck the Defer Layout Update to apply changes to the report.
Saving Reports and Refreshing Data
The connection provided through the downloading of the ODC file and opening it into PivotTables has an associated authentication token. This will expire after a day. In order to refresh the data in a report that has been built, you must follow the steps below:
- Have the saved report open in Excel. If you notice a warning message when opening it, simply proceed with the steps listed below to remove the warning message.
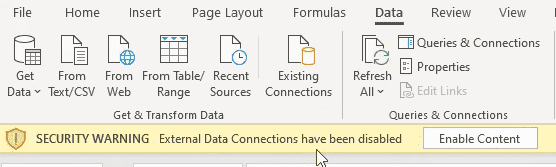
Figure 5 - Security warning to prompt a re-authentication against a new copy of the ODC file
- Use your browser to navigate to the Insights page within IdeaPlace and download a new ODC file from the Export menu.
- Within Excel, navigate to the Data tab and the Queries & Connection option.
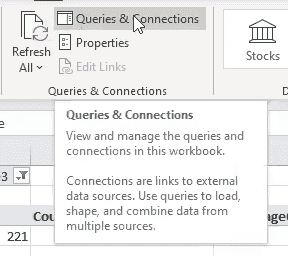
Figure 6 - Queries & Connections manager. Clicking opens the dialog panel to refresh data.
- Once the Queries & Connections panel opens on the right side, you will see the SpigitModel listed.
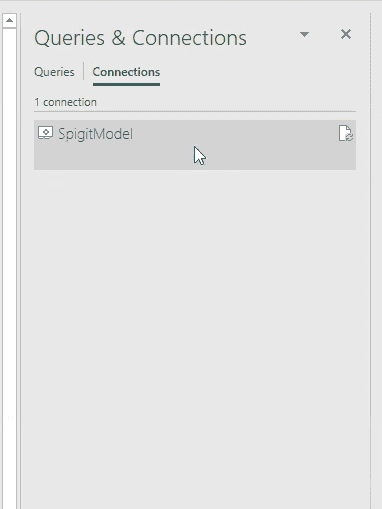
Figure 7 - Connections dialog panel
- Right-click and select Properties from the list to open the connections dialog and select the Definition tab from the navigation ribbon.
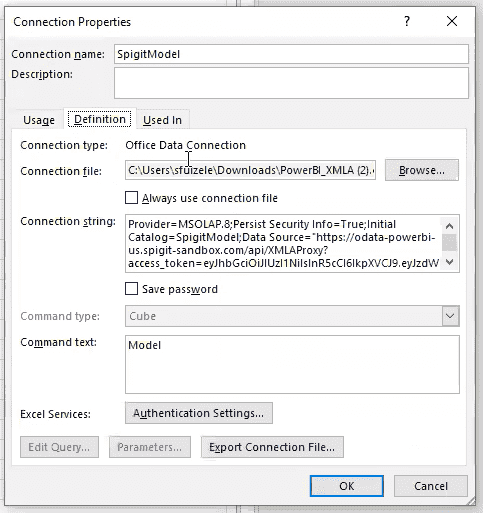
Figure 8 - Connection properties, definition tab selected
- Using the Browse option on the connection file line, you should now locate the file that you downloaded in Step 2 above.
- After clicking OK, a warning message will appear. Click Yes.
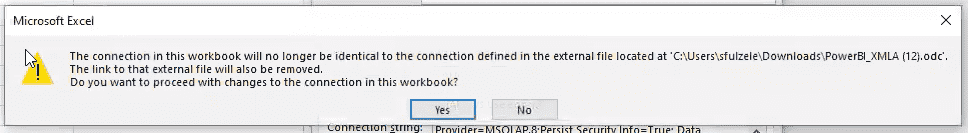
Figure 9 - Action prompt for re-establishing the connection to the live model
- The queries and connections panel will now refresh.
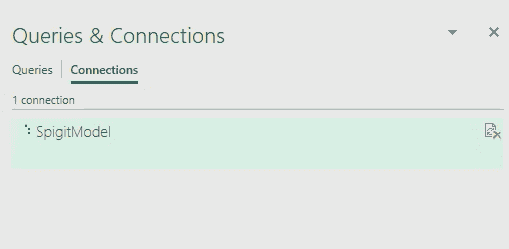
Figure 10 - Connection being established
- Once completed, you are now free to make amendments to your report or simply save it with up-to-date data.