
Creating and Editing Reports
Introduction
Our new analytics feature offers a best in class report building and visualization capability set which is fully available to users holding the Report Creator role in a given challenge or community. In order to move into creating and editing reports, click the Edit or Create options from the Report Menu in the top right navigation of the Insights page.
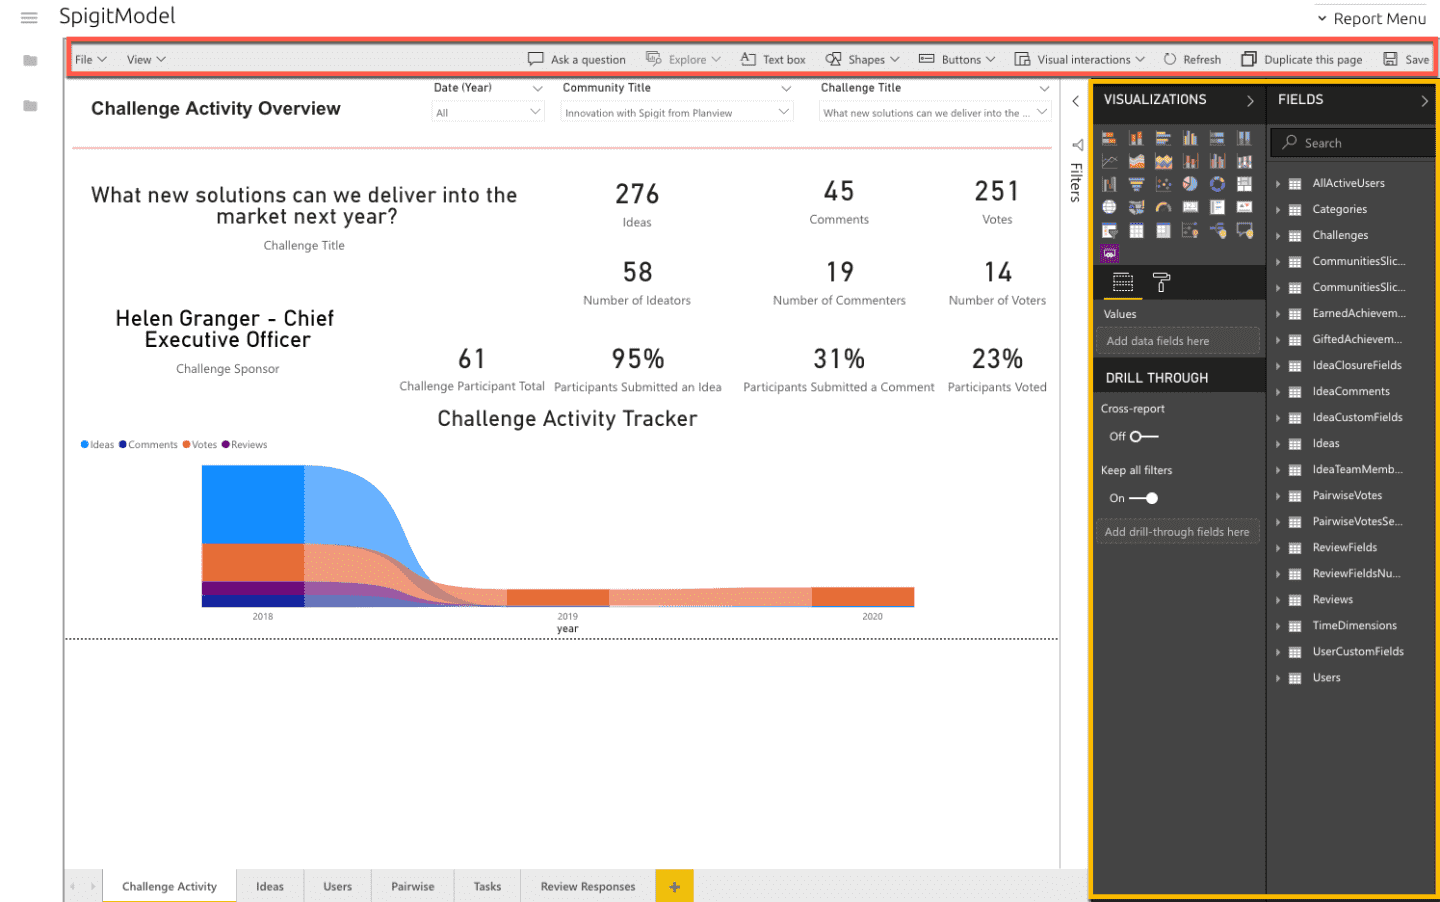
Figure 1 - Report Creation & Editing View
Figure 1 shows the new interface that opens once a Report Creator clicks Create or Edit from the menu. These components are now powered by Power BI and allow the user to access the full suite of features provided with the Power BI Embedded solution.
There are two areas that a Report Creator can interact with which will help to produce visualizations and reports that match brand, analytics, and data requirements for their particular program.
Main Navigation
Highlighted in red, this ribbon offers the standard set of options that cover saving, formatting, and design for the report pages themselves. Here you can access:
- File – Save a copy of the report and Save As
- View – Control the panel being displayed, add grid lines, and control edit options for visualizations
- Ask a Question – This is an AI feature that powers a chat bot which can be used to query your data. Find out more here.
- Text Box/Shapes/Buttons – All allow for the insertion of specific design elements that can bring your reports to life visually.
- Visual Interactions – Another great feature of Power BI Embedded is the ability to link visualizations. For example, clicking the data point in one visualization will filter the rest of the report. Find out more here.
- Refresh – Reloads the page.
- Duplicate this page – Allows the user to duplicate the page into a new tab within the report. All visualizations, filters, and slices will be duplicated as part of this process and a new tab automatically added.
- Save – This will save a version of the current report.
Visualizations and Fields
In figure 1, the yellow highlighted area contains the two main report editing and creating option columns. These are consistent in behavior across all Power BI applications (Desktop, Cloud, and Embedded). Microsoft provides in-depth learning and support for Power BI Embedded users which can be accessed here.
Fields
This section provides access to your data via a list of fields that are sourced from the Planview IdeaPlace data schema. These tables are named to reflect the contents within them. To select a field, simply click the dimension name and the list will expand. You can see a wider panel by sliding the field column edge to the left.
By selecting a dimension from the list, it will add it automatically to the visualization column and the report panel simultaneously.
Visualization
The visualization panel offers a wide variety of pre-built options for your data. These range from simple tables to more advanced decision trees and key influencers. All of these visualizations are offered for use within Insights.
Each visualization can be configured easily by using the Values  or Fields icon which controls field labels, calculations, and drill steps.
The Format icon  offers full control of design, label placement, fonts, and many other options.
Filters
The standard reports have been designed to use three key filters that span across all pages within the report. These three filters are:
- Date (Year) – This is a time dimension that allows users to filter visualizations by date.
- Community Title – This filter shows all communities present within the IdeaPlace instance.
- Challenge Title – This filter is linked to Community Title and only shows challenges linked to the filtered Community Title (if used).
These filters, once selected, will update all visualizations across the report. Cancelling them will revert all report level filters.