
Predictions in Action
Introduction
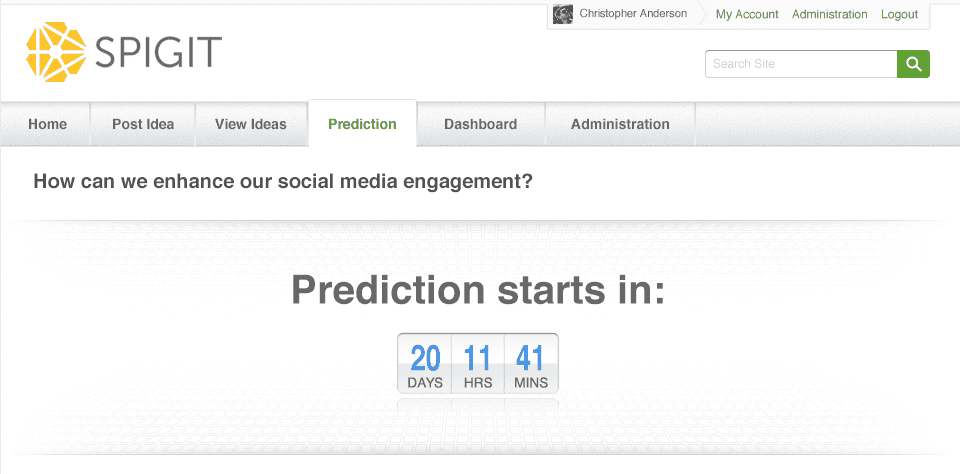
When you include predictions in a challenge, members will be invited to provide prediction votes on posted ideas. By default, the Prediction tab is not displayed until the Predictions Phase begins. However, if the Prediction tab has been turned on (through the Site Editor) before the Prediction Phase starts, the tab displays a countdown.
How it Works
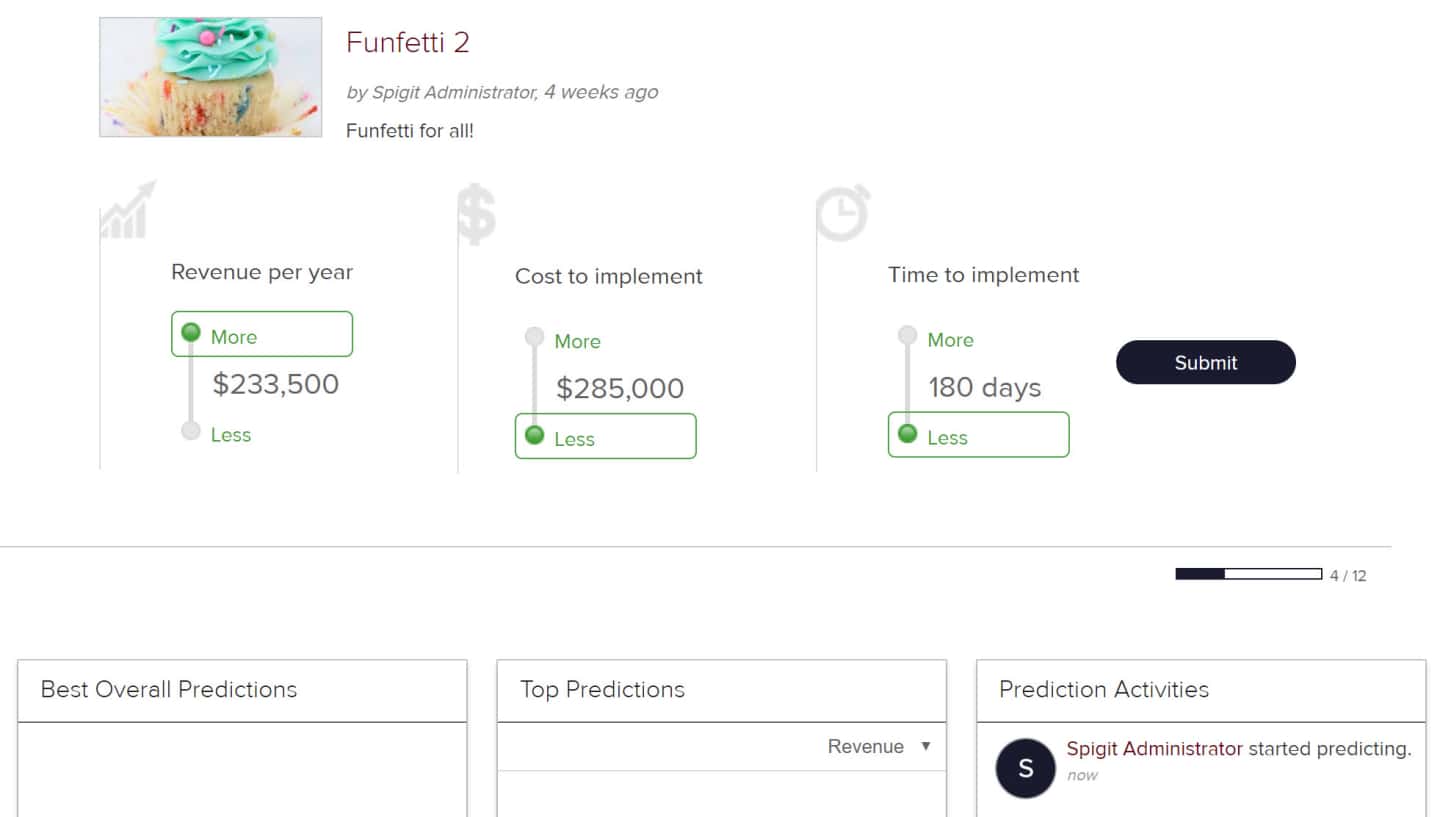
Once the Predictions phase begins, the prediction tab allows members to provide assessments for all submitted ideas in the graduation stage, based on the criteria you selected (time to implement, cost of implementation, and/or anticipated yearly revenue). A progress meter shows how many predictions have been done, and how many remain.
Prediction assessment page


User has completed predictions
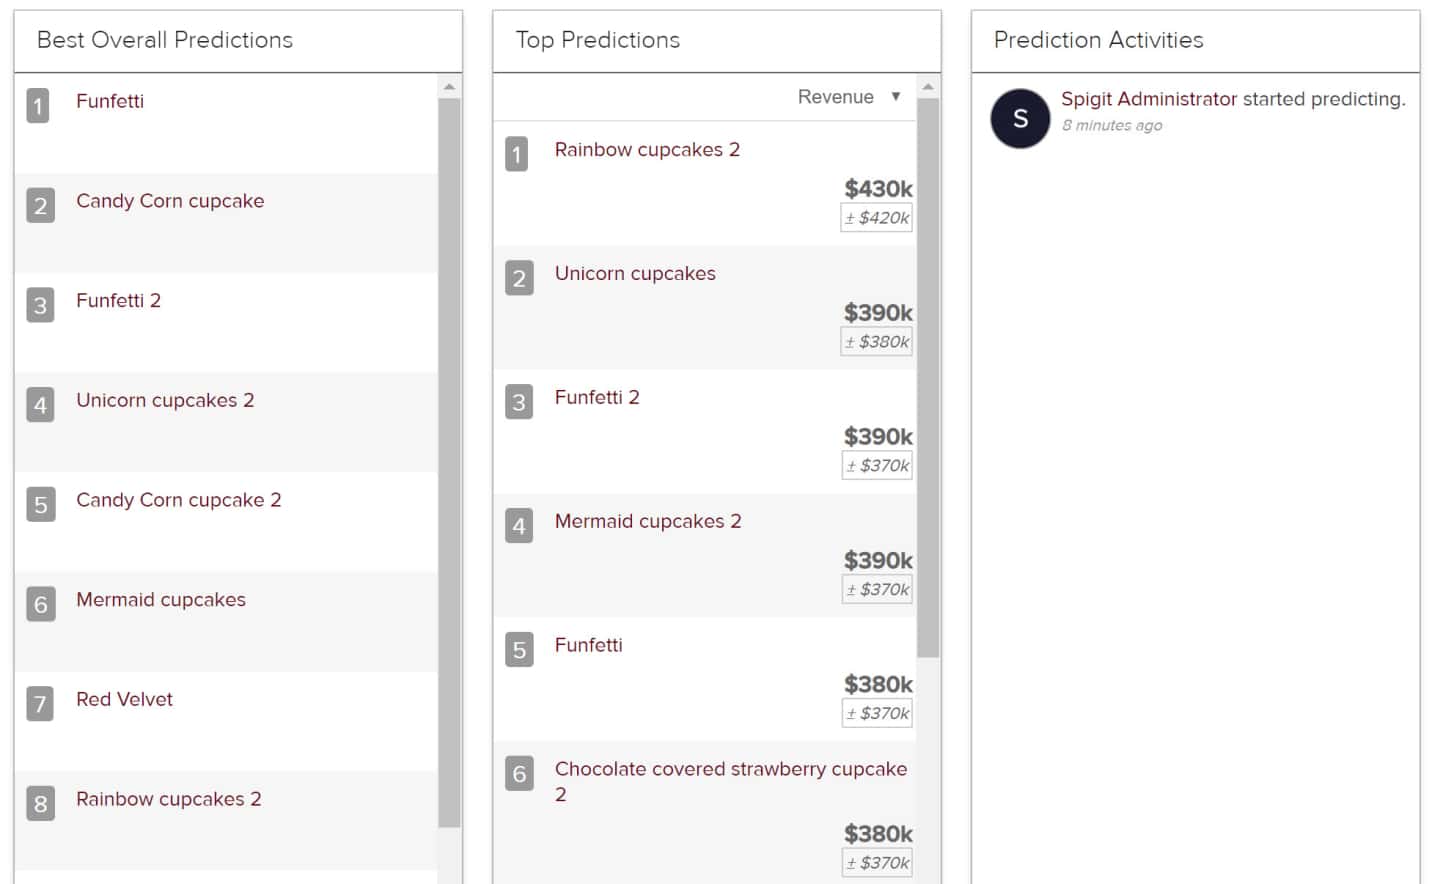
When a user has submitted predictions on all ideas, a Success message will display, and the Prediction tab will display the leaderboards, including one titled Best Overall, calculated using a combined measurement, approximately equal to (revenue - cost) / time. (Administrators and Challenge Sponsors will be able to view the leaderboards at all times.)
Prediction leaderboards
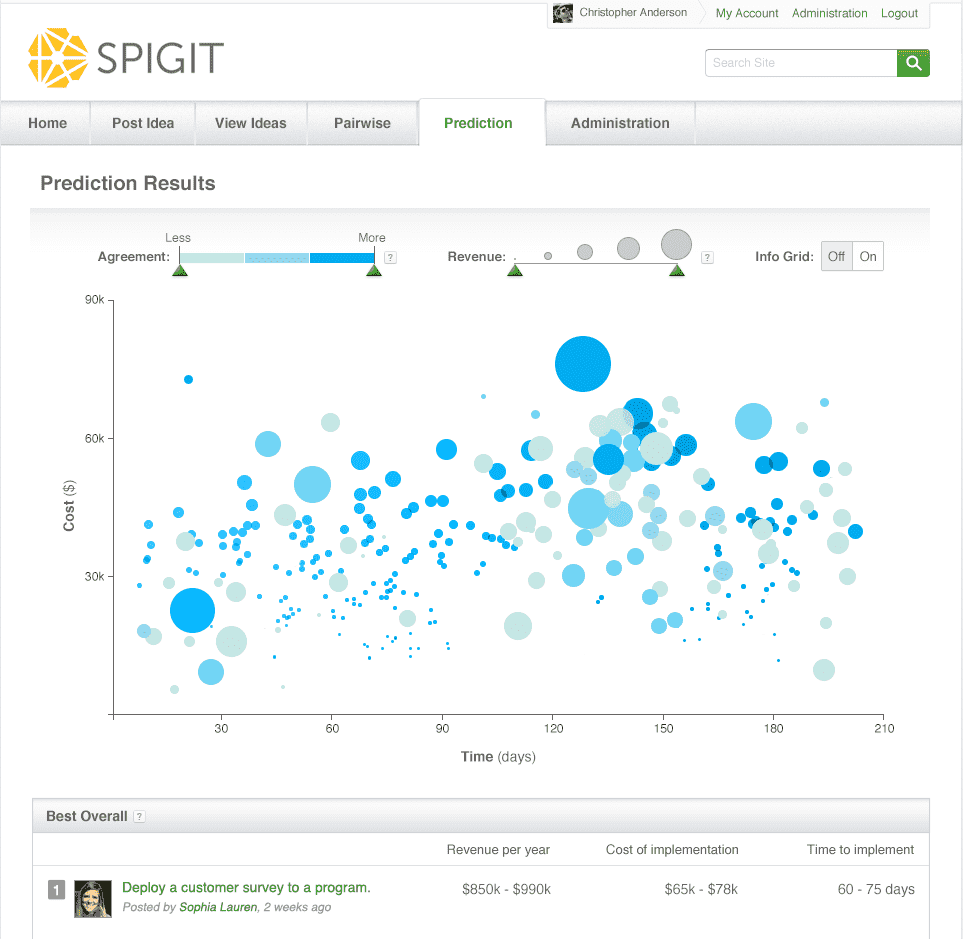
If all three prediction criteria were used (time to implement, cost of implementation, and anticipated yearly revenue), at the end of the predictions phase, the Results tab is displayed. Here you can view the Best Overall prediction chart displayed as a bubble graph with cost as the y-axis and time as the x-axis.
NOTE
Older versions of Internet Explorer may not support displaying the prediction chart.
Prediction Results page
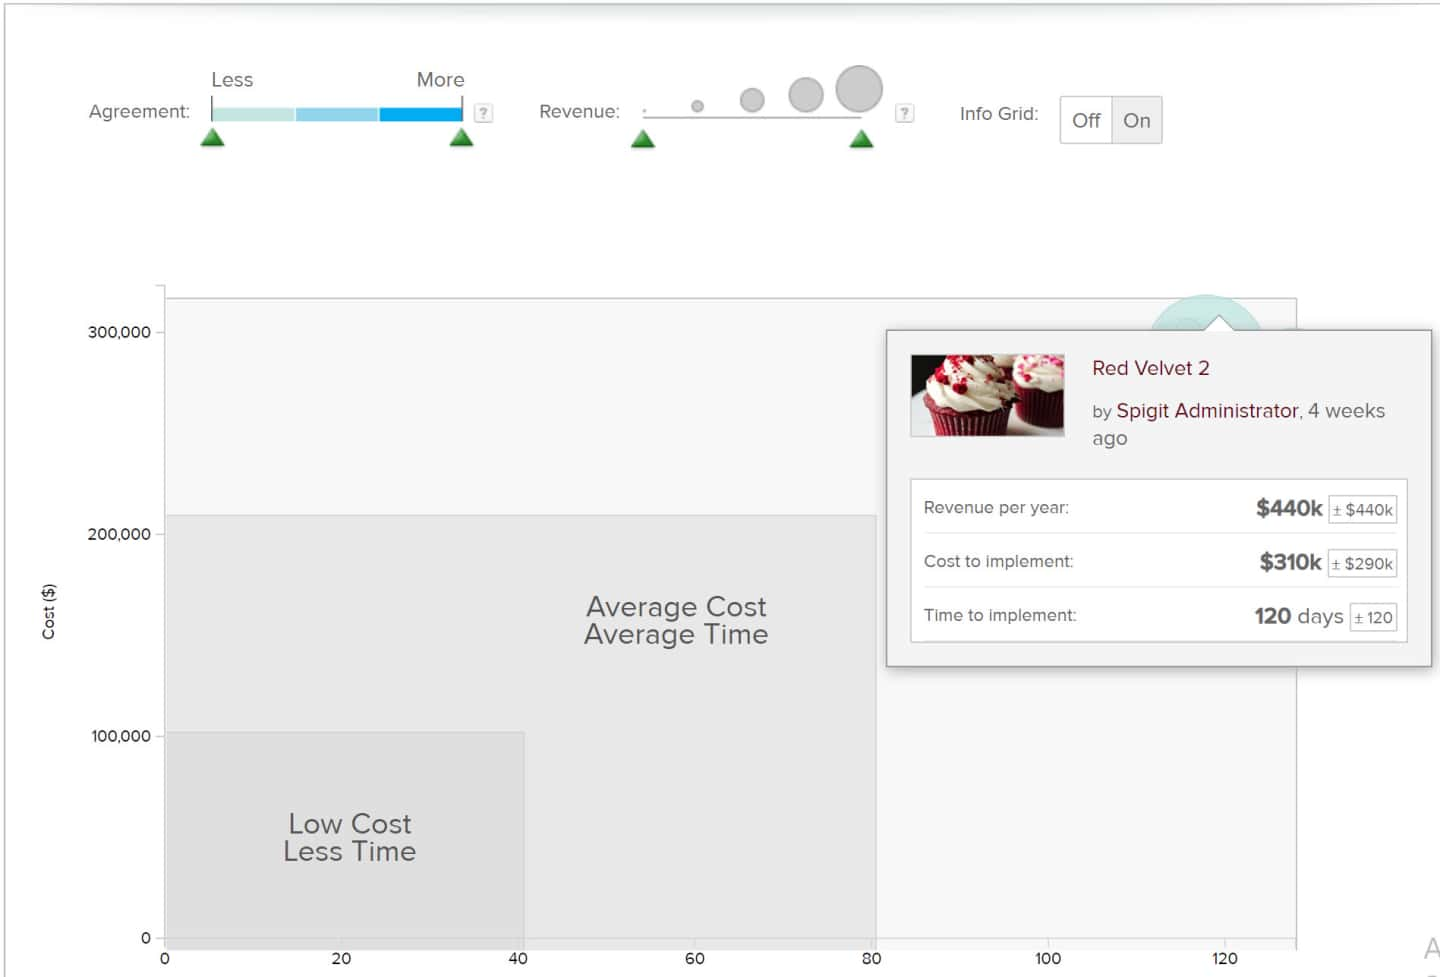
Users can ...
- Hover over a bubble to learn who submitted that prediction.
- Adjust the display using the green triangles under the Agreement and Revenue bars.
- Display the Info Grid using the On and Off buttons at the top right corner of the graph.
Revenue popup