Power BI
| Power BI is a business intelligence data visualization tool from Microsoft, which can be used to explore specific types of Planview IdeaPlace data. It allows non-technical end users in your organization to create analytics by themselves, without the need for technical report development skills or a technical understanding of the data structure. The main advantage of this reporting solution is its simplicity of use, while still being mature enough that it can be also be used by report developers for complex data modeling and visualization scenarios. |
Power BI Consumption Options
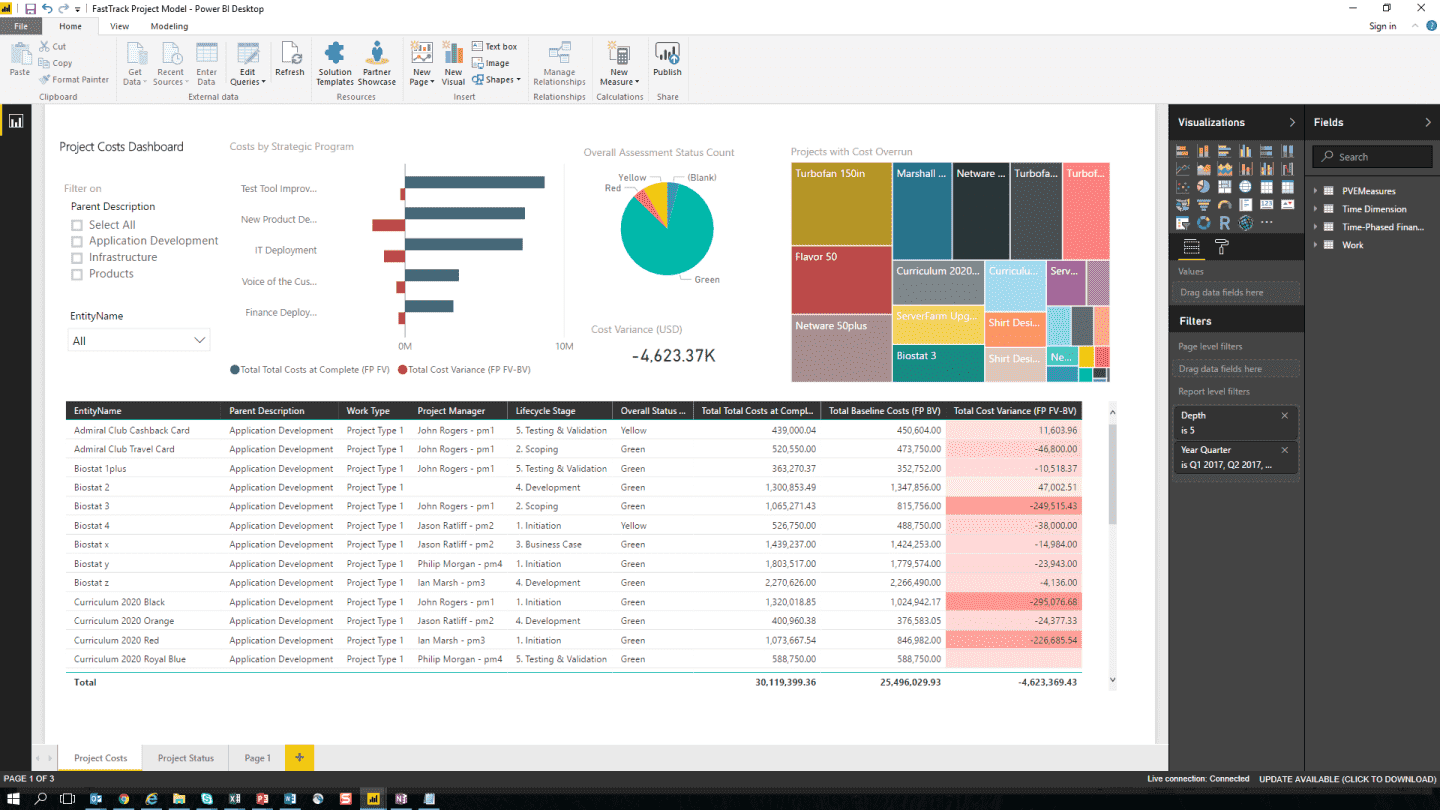
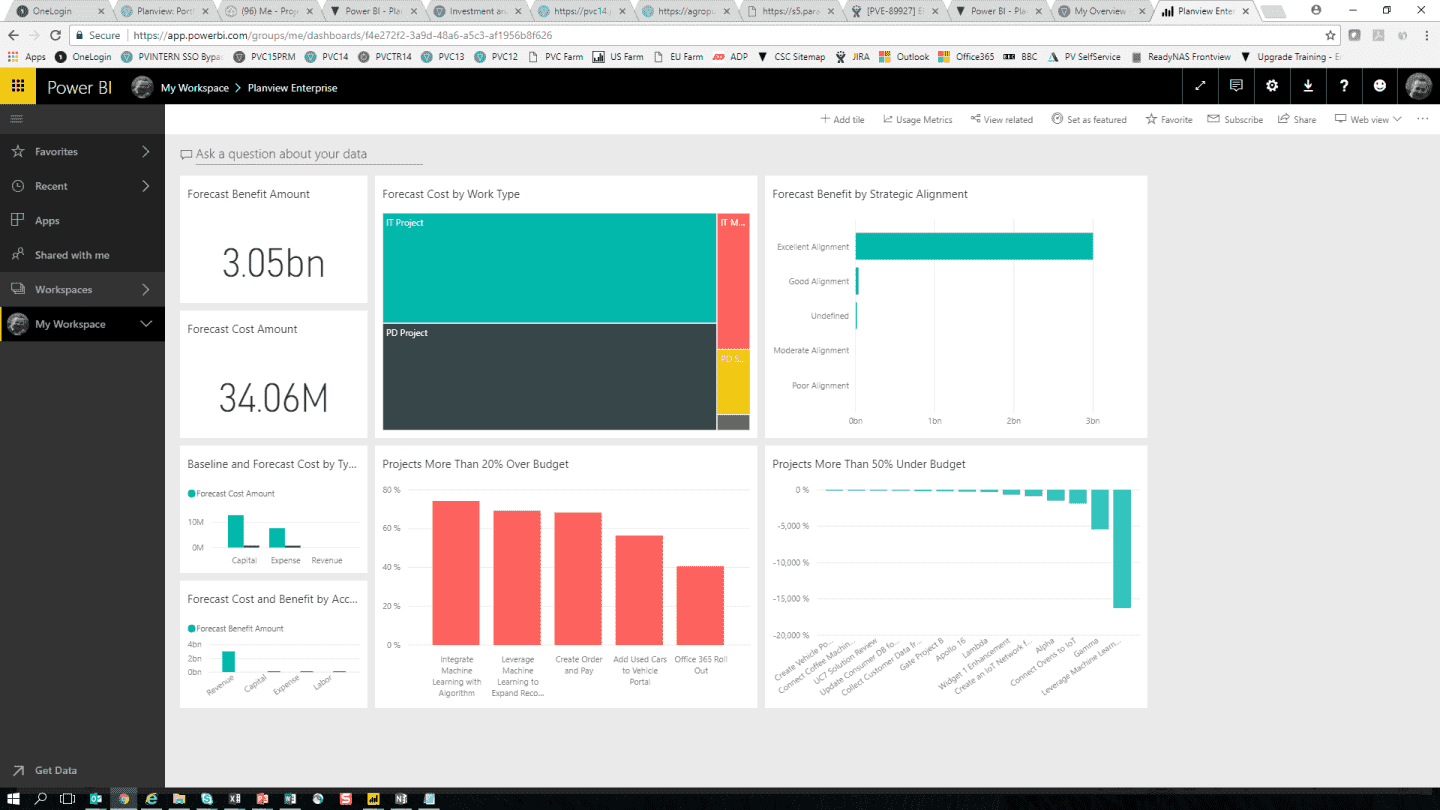
Power BI enables different consumption options for end users, including Power BI Embedded, Power BI Desktop, and the Microsoft PowerBI.com Service.
Power BI Embedded |
Power BI Desktop |
Power BI Service |
 |
 |
 |
|
|
|
Power BI Datasource Options
Power BI can consume data from a number of different datasources. Read the Power BI Datasource Options topic to understand the pros and cons of each and the steps required to prepare the datasource.
Power BI Deployment Flow
The four steps below are required to get Power BI content in front of your IdeaPlace users. It is recommended that if customers wish to build a custom report, they engage with the Global Reporting Services (GRS) team in Planview Consulting and engage with their TAM to assist in deploying and operationalizing their use of Power BI.

- Power BI provides different consumption options (tools) for end users. Power BI Embedded is in IdeaPlace as of Release 4.5.
- Power BI is a data visualization tool that is connected to a data source, in this case the IdeaPlace data source.
- Once the data source is procured, Power BI is used to visualize the data and create interactive reports.
- Once the Power BI reporting content has been created, it can be distributed to stakeholders in your organization.
View How-to, Product Help, E-learning and Best Practice Content

