
TeamTap2 - Tap Drill Dashboard
Moving down from the overall Key Themes, we now have a tab which is a readout of all the key data on the selected Tap (Tap is selected by Drill Through on TeamTap1) which is designed to be a presentable tab.
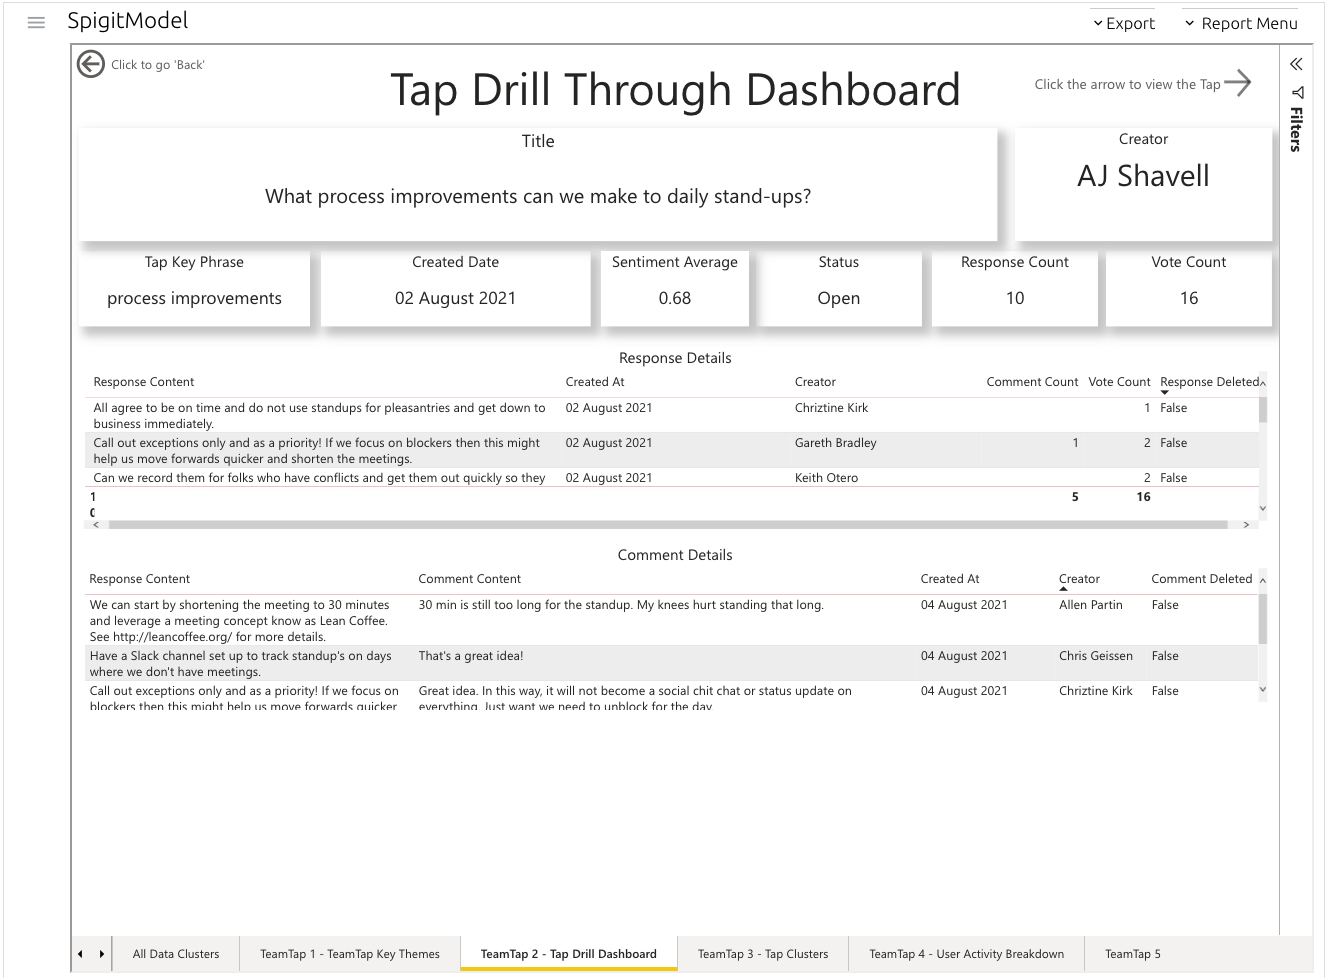
Figure 1 - TeamTap Tap Dashboard
The Tap Title, Tap Creator, Tap Key Phrase, Created Date, Comment Sentiment Score (Averaged), Status, Response Count, and Vote Count are all displayed here. There are two newer fields here which are defined below:
Key Phrase – This is the key phrase that has been analyzed for this Tap. It will normally be a one- or two-word phrase that is linked to the Tap Title and has been determined by the natural language processing engine.
Sentiment Average – This is a score that is produced by the sentiment analysis engine. It has read the comments within the Tap, scored them for positive, neutral, and negative, and then averaged that score out to indicate the reaction from the participants.
The Response Details table shows all responses and their associated data. This table is linked to the table below (Comment Details) and clicking a Response will filter the latter table, highlighting the conversations that have taken place on the Response. There is also a column which helps the user understand whether the content (Response or Comment) has been deleted in the user interface. This provides an audit trail.