
Legacy Excel Reporting
Introduction
The Challenge Wizard allows challenges to be run for as little as five minutes to support ideation methodologies that focus on a shorter time span, such as hackathons, or innovation sprints.
To further support these methodologies, we embedded a series of Excel-based reports that can be run instantly from within IdeaPlace. These reports will help your team track idea progress and activity when running shorter events. For additional IdeaPlace reporting methodologies, see the article IdeaPlace Insights.
NOTE
No new Excel reports will be created, and we will no longer support the editing of existing reports as of April 30th 2021. A direct Excel connector to the Planview IdeaPlace application now permits customized Excel reports to be configured by using the Excel PivotTables functionality.
How it Works
Excel reports are available from the Reports page, which can be added as a navigation tab using the Site Editor, if desired. All reports are in .xlsx format and can be found at /Page/Reports.
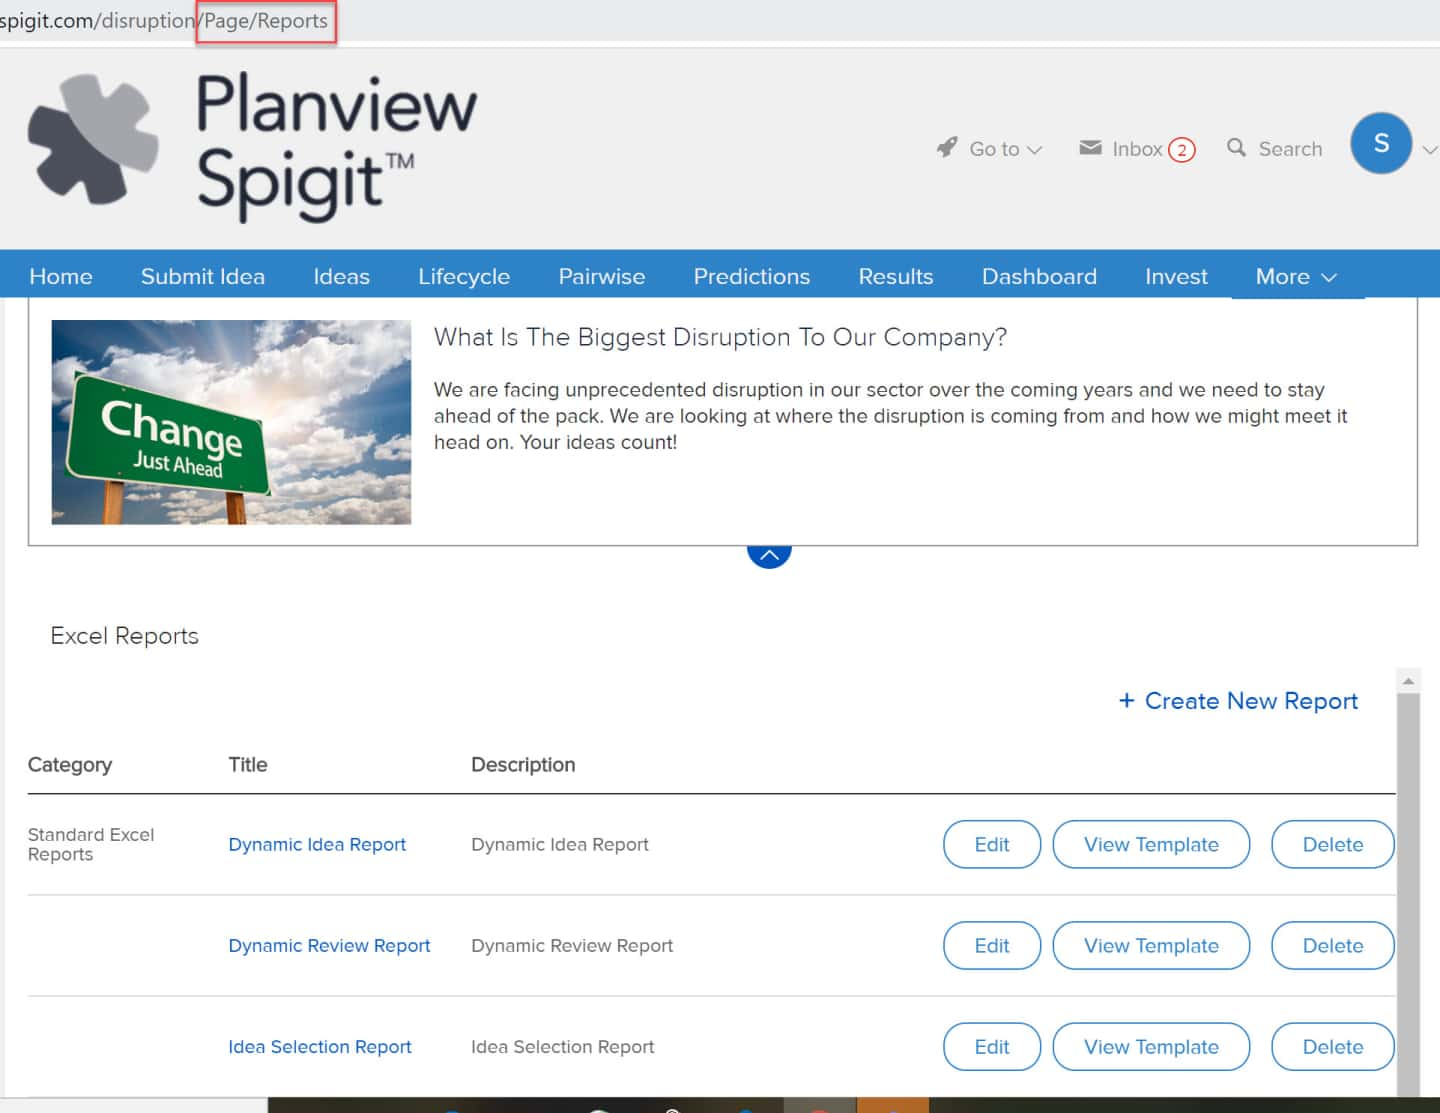
Fig 1 - Reports Page and its URL
This format benefits your team with support for a much larger data set: 1,048,576 records as compared to 65,536 records with .xls.
Available Reports
The fields listed in this article are the default values. Any customization is not included.
Dynamic Idea Report
This report gives an in-depth snapshot of the ideas submitted, including customized idea template fields, and idea engagement metrics (votes, comments, ratings, reviews). This can be run at any time during the challenge. It will include up to 25 idea template fields. Delete the empty columns from the report if you don’t have 25 idea template fields.
Fields included
|
Idea ID |
Email Address (of poster) |
Number of Comments |
|
Title |
Date Created |
Number of Replies |
|
Category |
Edit Date |
Number of Reviews |
|
URL |
Innovation Area (challenge) |
Overall Review Score |
|
Type |
Stage |
Number of Up Votes |
|
Thread (Comment or Reply text) |
Idea Fields (up to 25) |
Number of Star Votes |
|
Name (of poster) |
Team Members |
Star Rating |
|
Username (of poster) |
Tags |
|
Example Report
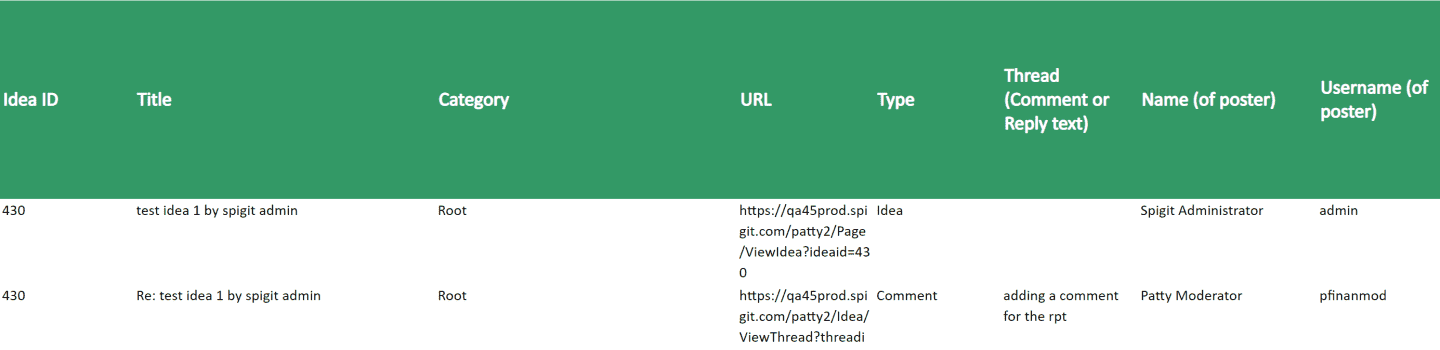
Fig 2 - Dynamic Idea Report
Dynamic Review Report
This report displays all completed reviews and tasks. Run this to find out the current idea review rating during the Expert Review Phase of the Challenge. The input parameter is the review form name. Delete the empty columns from the report for the empty evaluative fields.
Fields included
|
Idea Title |
Category |
Review Author |
|
Idea URL |
Stage |
Individual Review Score |
|
Idea Author |
Overall Review Rating |
Quantitative Criteria responses |
|
Idea ID |
Task Type |
Qualitative Criteria responses |
Example Report
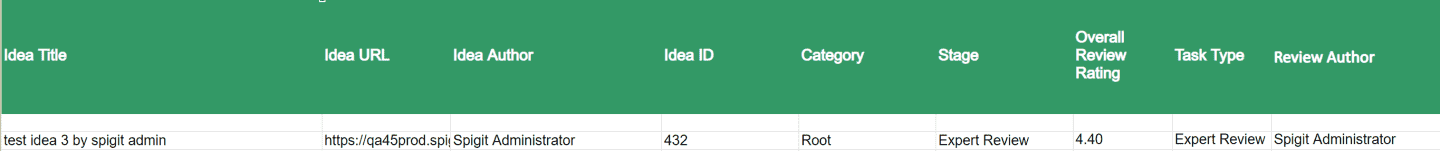
Fig 3 - Dynamic Review Report
Idea Selection Report
This report can be used when conducting the final review of ideas. Input parameter is the idea stage name. These four worksheets provide all the data needed to consider whether an idea should be moved to Successfully Implemented. Use this at the end of the challenge, when meeting as a group, to determine your final successful ideas; it can be used to facilitate an effective selection meeting. See this article for more information on how to facilitate a meeting for selecting ideas.
Idea Description worksheet
This provides basic idea information.
Fields included
|
Idea ID |
Idea URL |
Stage |
|
Title |
Idea Author |
Idea Template Fields (up to 18) |
|
Category |
Date Created |
|
You may want to replace the Field1, Field2 column headings with the actual idea template field names and remove any empty columns.
Example Report
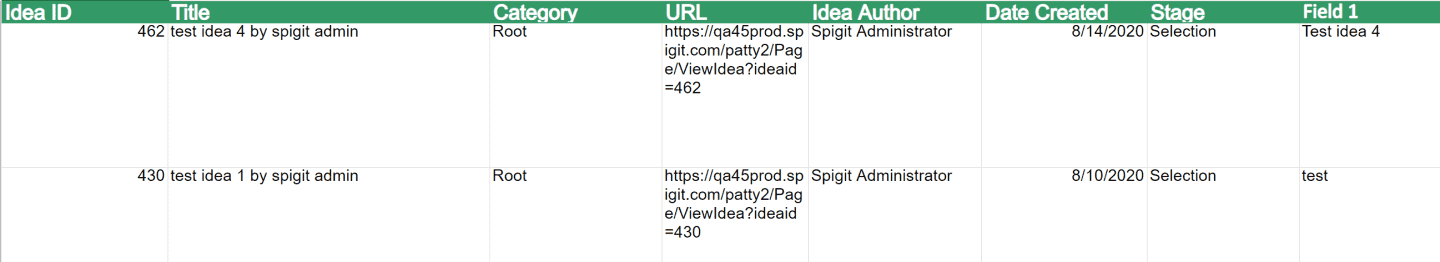
Fig 4 - Idea Selection Report - Idea Description worksheet/tab
Idea Stats worksheet
This provides the data around the idea including data from Pairwise and Reviews.
Fields included
|
Idea ID |
Date Created |
Number of Comments |
|
Title |
Stage |
Number of Up Votes |
|
Category |
Star Rating |
Star Votes |
|
Idea URL |
Pairwise Rank |
Number of Pairwise Votes |
|
Idea Author |
Overall Review Score |
|
Example Report

Fig 5 - Idea Selection Report - Idea Stats worksheet/tab
Review Scores Worksheet
This provides the results of the completed reviews done by your Experts.
Fields included
|
Idea ID |
Idea Author |
Individual Review Score |
|
Idea Title |
Overall Review Rating |
Quantitative and Qualitative Criteria fields (a total of 10 fields) |
|
Category |
Task Type |
|
|
URL |
Review Author |
|
You may want to replace the Field1, Field2 column headings with the actual review criteria fields and remove any empty columns.
Example Report

Fig 6 - Idea Selection Report - Review Scores worksheet/tab
Selection Worksheet
This allows you to complete data as a group to help make the final selection decision. The fields listed are those on the Closed Successfully page. (If the report is used for ideas in the Implemented stage, the fields will remain blank.)
Fields included
|
Idea Id |
Primary Impact (Time savings, Cost savings, or Revenue generating) |
Idea Steward |
|
Title |
Estimated Value Range of Impact (i.e. $100,000- $200,000) |
Next Steps |
|
Idea URL |
Secondary Impact (Time savings, Cost savings, Revenue generating, Customer Experience, Employee Experience, NPS) |
|
|
Selected for Next Actions (yes/no) |
Estimated Value Range of Secondary Impact (i.e. $100,000- $200,000) |
|
Example Report
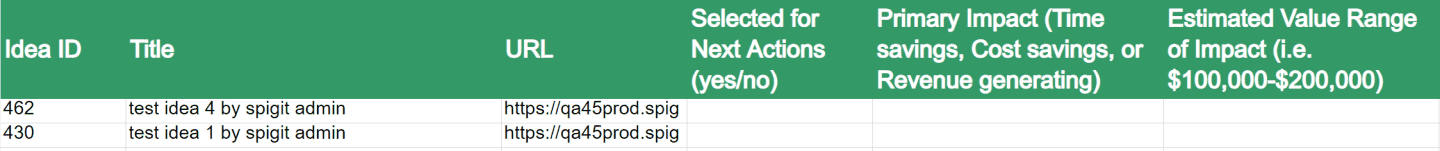
Fig 7 - Idea Selection Report - Selection Worksheet
Idea Tracking Report
This report shows all ideas closed successfully and records up to 14 closed data fields. Use this report to track idea details that have been selected for implementation. See more information on the Idea Closure form here.
Fields included
|
Idea ID |
URL |
Date Closed |
|
Title |
Idea Author |
Idea Closure Fields (up to 14 fields) |
|
Category |
Challenge Title |
|
You may want to replace the Field1, Field2 column headings with the actual idea closure fields and remove any empty columns.
Example Report
![]()
Fig 8 - Idea Tracking Report
Ideas Activity Report
This report shows all ideas’ graduation criteria fields and how close they are to reaching the threshold set for graduation to the next stage. Use this report towards the end of a phase to see if any ideas should be manually moved to the next stage. This in-depth view of idea activity and engagement includes the source of where the idea was submitted, either by Desktop or Mobile. It also includes closed ideas.
Fields included
|
ID |
|
Age (in days) [value/threshold] |
|
Category |
Full Name |
Total Votes (value/threshold) |
|
Title |
Stage |
Number Posts (value/threshold) |
|
Description |
Likes |
Review Count (value/threshold |
|
URL |
Star Votes |
Review Rating (value/threshold) |
|
Tags |
Star Rating |
Team Size (value threshold) |
|
Post Date |
Comments (Number) |
Role Approval Needed for Graduation |
|
Modified On |
Conversational Level (value/threshold) |
Moderator |
|
Username |
Views (value/threshold) |
Expert |
You may want to remove any columns that were not used as graduation criteria.
Example Report
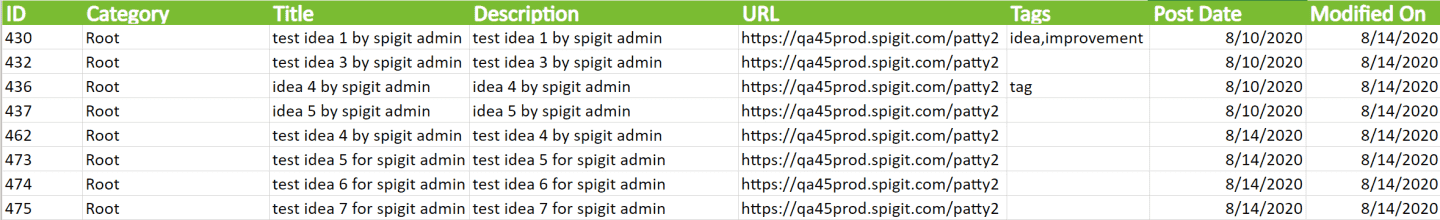
Fig 9 - Ideas Activity Report
Private Comments Report
This report lists any ideas that have had Private Comments posted by either an Administrator or Moderator. The first row is the idea information and the second row is the private comment, along with the information about the poster. Use this report to review ideas that have had private comments posted and may need special attention.
Fields included
|
Idea ID |
Email Address (of poser) |
Number of Comments |
|
Title |
Date Created |
Number of Replies |
|
Category |
Edit Date |
Number of Reviews |
|
URL |
Innovation Area (challenge) |
Overall Review Score |
|
Type |
Stage |
Number of Up Votes |
|
Thread (Comment or Reply text) |
Idea Fields |
Number of Star Votes |
|
Name (of poster) |
Team Members |
Star Rating |
|
Username (of poster) |
Tags |
|
You may want to replace the Field1, Field2 column headings with the actual idea template fields and remove any empty columns.
Example Report
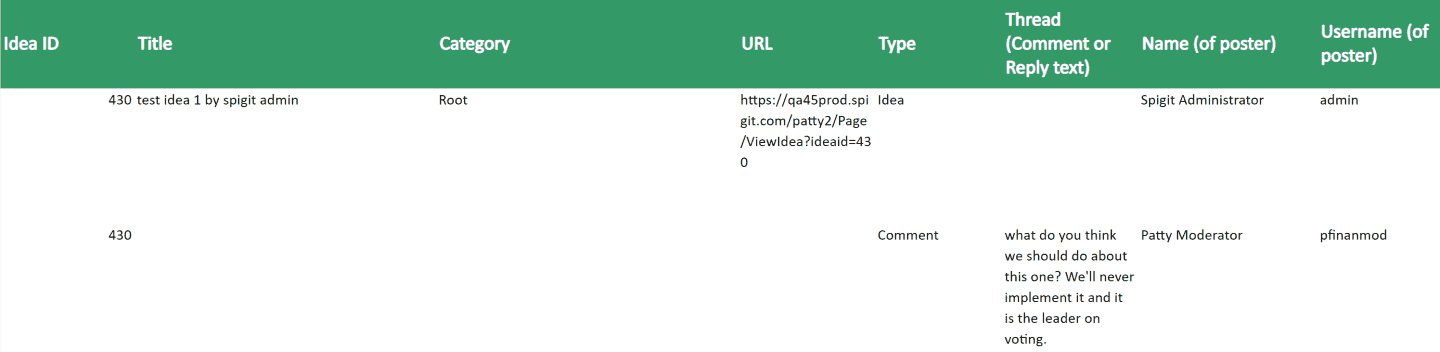
Fig 10 - Private Comments Report
Rapid Report
This report gives you the Pairwise ranking, the idea stats, and the review scores. It is used to compare the ideas and where they were ranked by the crowd and your review team. It can be run at any time, but it is recommended to wait until the Pairwise phase has ended. By using all three of these worksheets, you’ll get a holistic picture of the activity around your top ideas.
Pairwise Idea Activity worksheet
This gives the Pairwise ranking and statistics for ideas.
Fields included
|
Idea ID |
Times Not Selected |
Full Name |
|
Category |
Times Skipped |
Comments |
|
Title |
Total Times Offered |
Views |
|
Pairwise Ranking |
Username |
|
|
Times Selected |
|
|
Example Report

Fig 11 - Rapid Report - Pairwise Idea Activity worksheet
Rapid Short List worksheet
This lists the ideas and how many star votes the ideas received, along with the number of comments and replies. Use this to see the ideas’ voting breakdown if you used star voting.
Fields included
|
Category |
1 Star Votes |
5 Star Votes |
|
Title |
2 Star Votes |
Comments |
|
Star Rating |
3 Star Votes |
Replies |
|
Submitted By |
4 Star Votes |
|
Example Report

Fig 12 - Rapid Report - Rapid Short List worksheet
Rapid Winners worksheet
This lists the review score of each idea, sorted in score order.
Fields included
|
Category |
Full Name |
|
|
Title |
General Review Score |
|
Example Report

Fig 13 - Rapid Report - Rapid Winners worksheet
User Tasks Report
Use this report during your Expert Review phase of the challenge to track who has been assigned tasks, which are outstanding and which have been completed. This can be run at any time. There are four worksheets included.
Summary worksheet
This gives the overview of tasks by person.
Fields included
|
Category |
Last Name |
Open Task Count |
|
First Name |
Task Type |
Completed Task Count |
Example Report

Fig 14 - User Tasks - Summary worksheet
Summary by Person worksheet
This report lists, by person, the number of tasks that are open and closed.
Fields included
|
Category |
Last Name |
Open Task Count |
|
First Name |
Task Type |
Completed Task Count |
Example Report

Fig 15 - User Tasks - Summary by Person worksheet
Open Task Detail worksheet
This lists tasks that have been assigned but not completed.
Fields included
|
Category |
Title |
Date Created |
|
First Name |
Idea URL |
Due Date |
|
Last Name |
Idea Stage |
Description |
|
Idea ID |
Open Task Type |
|
Example Report

Fig 16 - User Tasks - Open Task Detail worksheet
Completed Task Detail worksheet
This lists the completed review, by individual score, for all ideas.
Fields included
|
Category |
Title |
Individual Review Rating |
|
First Name |
Idea URL |
Overall Review Rating |
|
Last Name |
Idea Stage |
Completed |
|
Idea ID |
Completed Task Type |
|
Example Report

Fig 17 - User Tasks - Completed Task Detail worksheet
Users with No Activity Report (Report for Enabled users with no activity since a given date)
This report lists users who have not taken any action since the given date. The input parameter is date/year and hour/minute time frame. Mm/dd/yyyy hh:mm AM EST is the format. The lockuser field can be used to disable users in bulk. Please see this article.
Fields included
|
firstName |
primaryEmail |
lockuser |
|
lastName |
userName |
|
Example Report
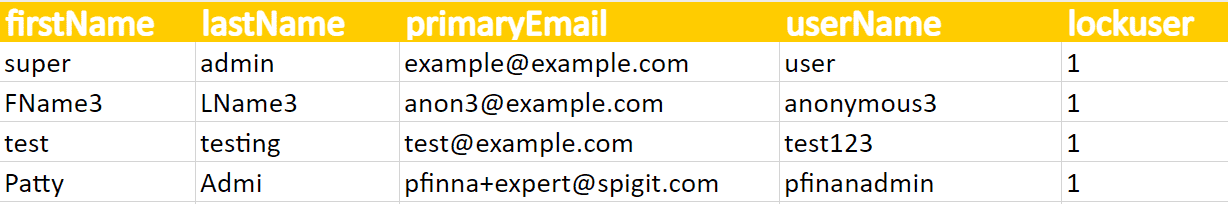
Fig 18 - Users With No Activity Report
Moderator and Expert Activity Detail Report
This report lists the activity of all moderators and experts within a given date range. The input parameter format is MM/dd/yyyy.
Fields included
|
First Name |
Role |
Date of Action |
|
Last Name |
Action |
URL |
|
|
Idea Title |
|
Example Report
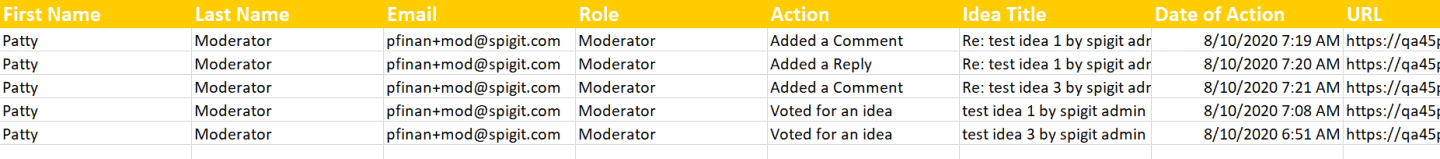
Fig 19 - Moderator and Expert Activity Detail Report
These Excel reports supplement what is already available through our Insights platform.