
November 2021 PBIX Updates
Introduction
The November 2021 update to the Power BI Embedded SpigitModel introduces major enhancements to the capabilities that Planview IdeaPlace delivers out of the box.
During our Accelerate 2021 event, we presented a vision for the future of innovation management that placed data driven decision making at its core. This journey to a true data driven innovation state starts and ends with data models. The great news is that with the November update of the SpigitModel, we are delivering the first of those data model capabilities into your hands.
In this summary, we will cover the main features contained within the update. Please use the corresponding left navigation tree in the CSC to dive deeper into the updates specific to each report tab.
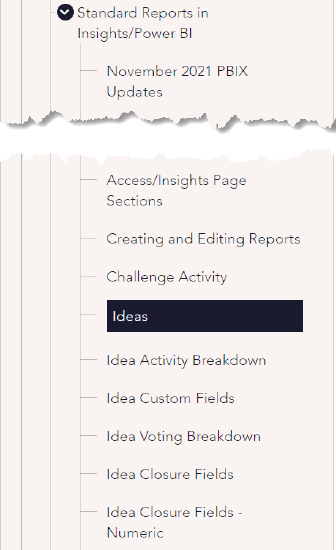
Figure 1 - Left Navigation Tree
User Experience Updates
Following assessments of user feedback over the last year, we have made a broad sweeping update to the user interface across the SpigitModel. This new approach better utilizes the space on each tab, highlighting visualizations and making key data points larger and easier to identify.
We have redesigned the slicer and filter experience by utilizing a new pop-up menu that can be accessed by clicking the hamburger menu icon ![]() . This allows slicers to be applied to the tab or across all tabs in the SpigitModel from the pop up. The pop up can be hidden and reset from this view by clicking the corresponding buttons.
. This allows slicers to be applied to the tab or across all tabs in the SpigitModel from the pop up. The pop up can be hidden and reset from this view by clicking the corresponding buttons.
The styling across the SpigitModel has also been updated to better reflect the content being presented. Text will now be larger with hover over explanations embedded into some of our more interesting or complex data visualizations.
User Activity Reports
We have been busy understanding the shifting requirements for user activity analytics and are pleased to announce that unified reports are now available! You can find two new user activity tabs that house specific visualizations.
In the User Activity / Challenge, you can find a standard table format (download ready) for activity which can be easily copied to your own custom reports. You can see idea, comment, vote, rating and pairwise vote counts against each user in this table. It’s also sliceable by challenge (using the treemap tile visualization or the slicer pop-up) and furthermore, you can customize it by adding any other user data, custom or standard, from the ActiveUserDetails folder.
The User Activity / Time tab displays a different spin on activity, tracking actions in a more aggregated way and slicing it by time. In this tab, you should expect activity counts to be lower as we detect the ideaID the activity is happening upon and then count it only once. For example, a user posting six comments on a single idea will count once, not six times here. Should you wish to see this visualization take the count per the User Activity / Challenge tab, you can copy that visualization and add individual actions from the ActiveUsers folder.
Idea Clustering
In a major enhancement, we are delivering analytics that cluster ideas by the concepts being referenced in their descriptions. We analyze each ideaContent field and then produce a key phrase list for each idea. This list is then cross referenced automatically against all other ideas and rendered in a word cloud visualization.
For the first time, you can slice this cluster data by challenge, groups of challenges, or instance wide. This offers deep insights into the themes emerging from your unstructured data, allowing a stronger framework from which to make decisions on trends being unearthed through your engagements.
This clustering is designed for a different purpose than the clustering found within the Comparable Ideas feature in the IdeaPlace application. That feature serves a specific purpose for user navigation, and therefore the Comparable Ideas feature leverages a different library for matching purely within a challenge.
The Idea Key Themes dashboard is the first in a set of three new tabs relating to idea insights. When selecting a cluster, a user can right click on the table below (selecting a row/idea) and then use the Drill-Through option that links directly to the Idea Sentiment Dashboard. This action provides access to a new idea level dashboard which is detailed below.
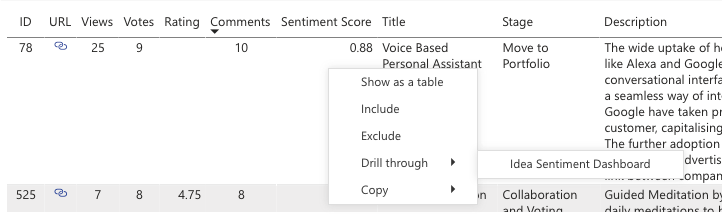
Figure 2 - Visualization Interactions
Idea Sentiment Dashboard
This dashboard is designed to be utilized as a drill through from the Idea Key Themes dashboard tab.
The visualizations here are centered around a single idea rather than a group of ideas. Each field corresponds only to the idea that was drilled through from the previous dashboard. The key capability highlighted on this tab is the idea sentiment score. Several visualizations demonstrate the current sentiment score for the idea.
Sentiment is based upon an analysis of the comment text that has been posted on the selected idea. The analytics engine reads the sentence structure, text and length before coming up with a score for each comment based upon the 0-1.0 range. We demonstrate scoring visually using the decomposition tree (the sum and then the breakdown per comment), a conditionally formatted tracking of average score and then core metrics such as votes and rating.
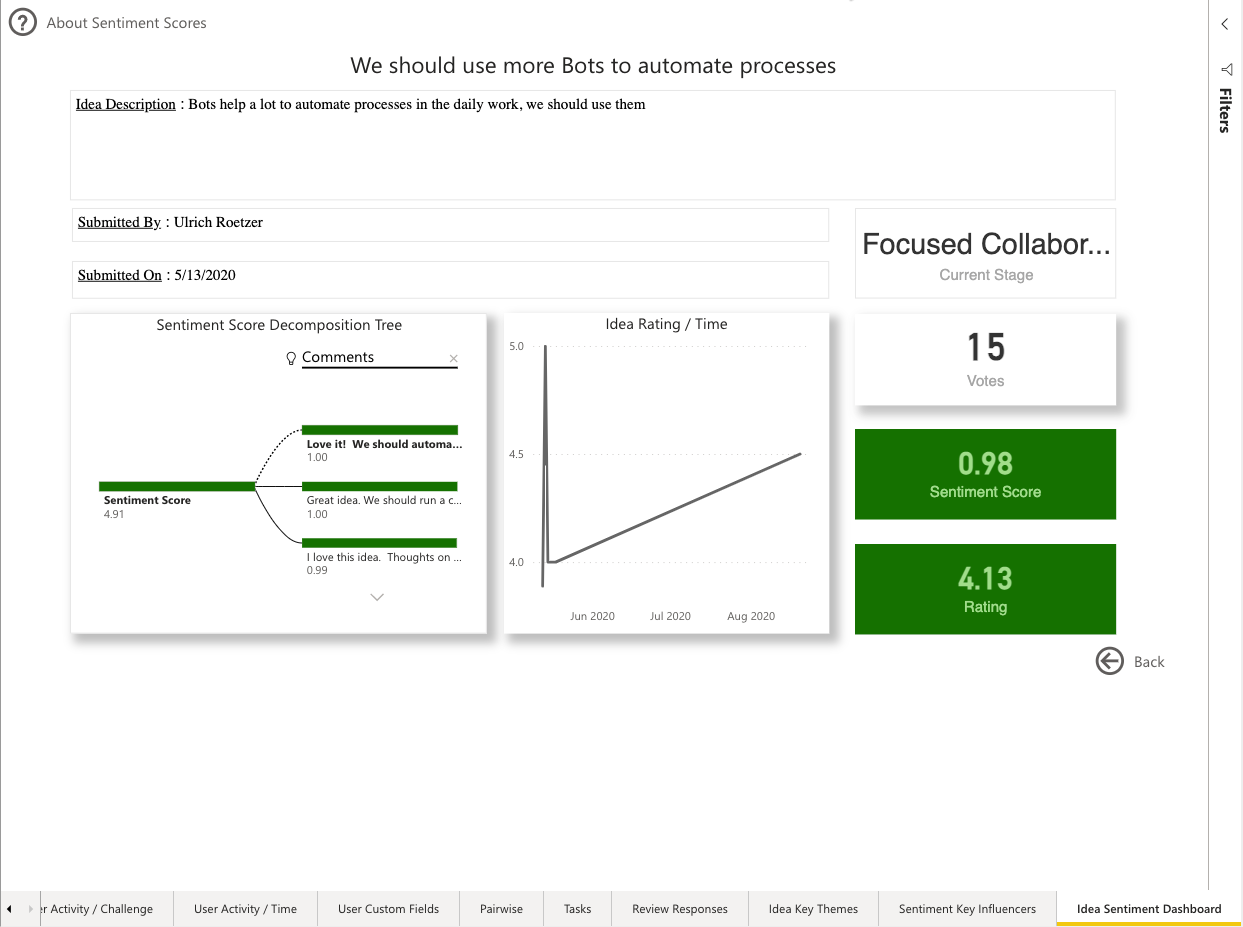
Figure 3 - Idea Sentiment Dashboard
Sentiment Key Influencers
The final new capability is designed to be more informational for Administrators. This visualization leverages machine learning to show what factors influence sentiment score. In the scenario on this tab, you will see the increase and decrease of sentiment explained by a set of trackable metrics such as votes, team members, comments etc. This can be copied to any custom report and from there, extra measures can be added as each Administrator desires.
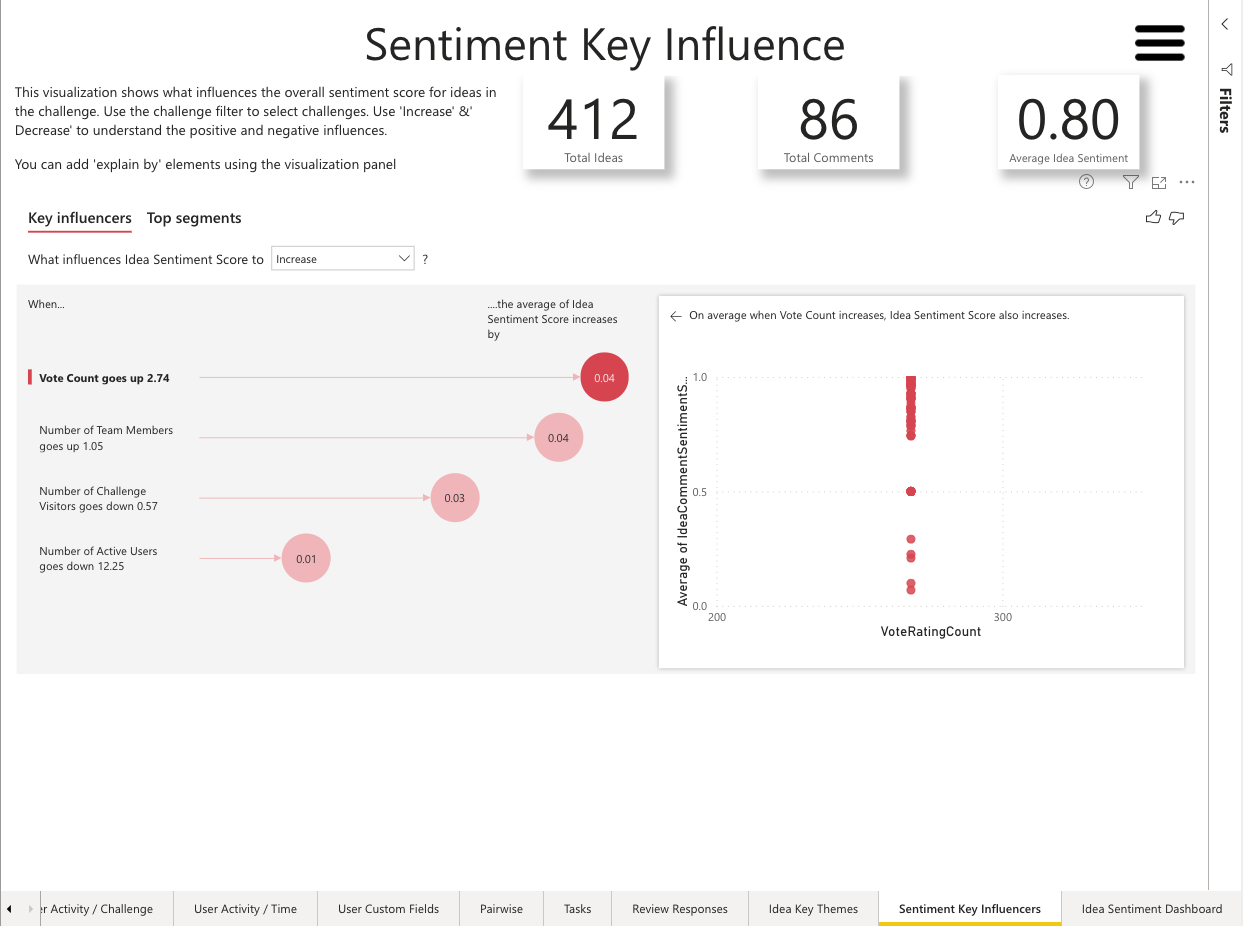
Figure 4 - Sentiment Key Influencers
Summary
In summary, we are adding:
- User Activity Reporting – two new tabs, a new metrics folder and three new visualizations
- Idea Key Themes Clustering – cross instance clustering of idea key themes, new tab and visualizations
- Idea Sentiment Analysis – a new tab to track sentiment scoring on comments
- Sentiment Analysis ML – a new tab showcasing how sentiment rises
The CSC articles that have been updated are:
Access Insights - Screenshot and Filter section updated
Challenge Activity - Screenshot updated
Ideas - Screenshot updated
Idea Activity Breakdown - Screenshot updated
Idea Custom Fields - Screenshot updated
Idea Voting Breakdown - Screenshot updated
Idea Closure Fields - Screenshot updated
Idea Closure Fields Numeric - Screenshot updated
User Activity Breakdown - Screenshot updated. Article name changed to User Activity Challenge
User Activity / Time – New Report
Pairwise - Screenshot updated
Reviews - Report name changed to Tasks. Screenshot updated
Review Responses - Screenshot updated
Idea Key Themes – New Report
Sentiment Key Influencers – New Report
Idea Sentiment Dashboard – New Report