Idea Custom Fields
This section provides an out of the box search and filter capability for all idea template custom fields that are in use. This page works with the Community Title and Challenge Title to automatically filter the custom fields contained within the challenge or community’s idea form.
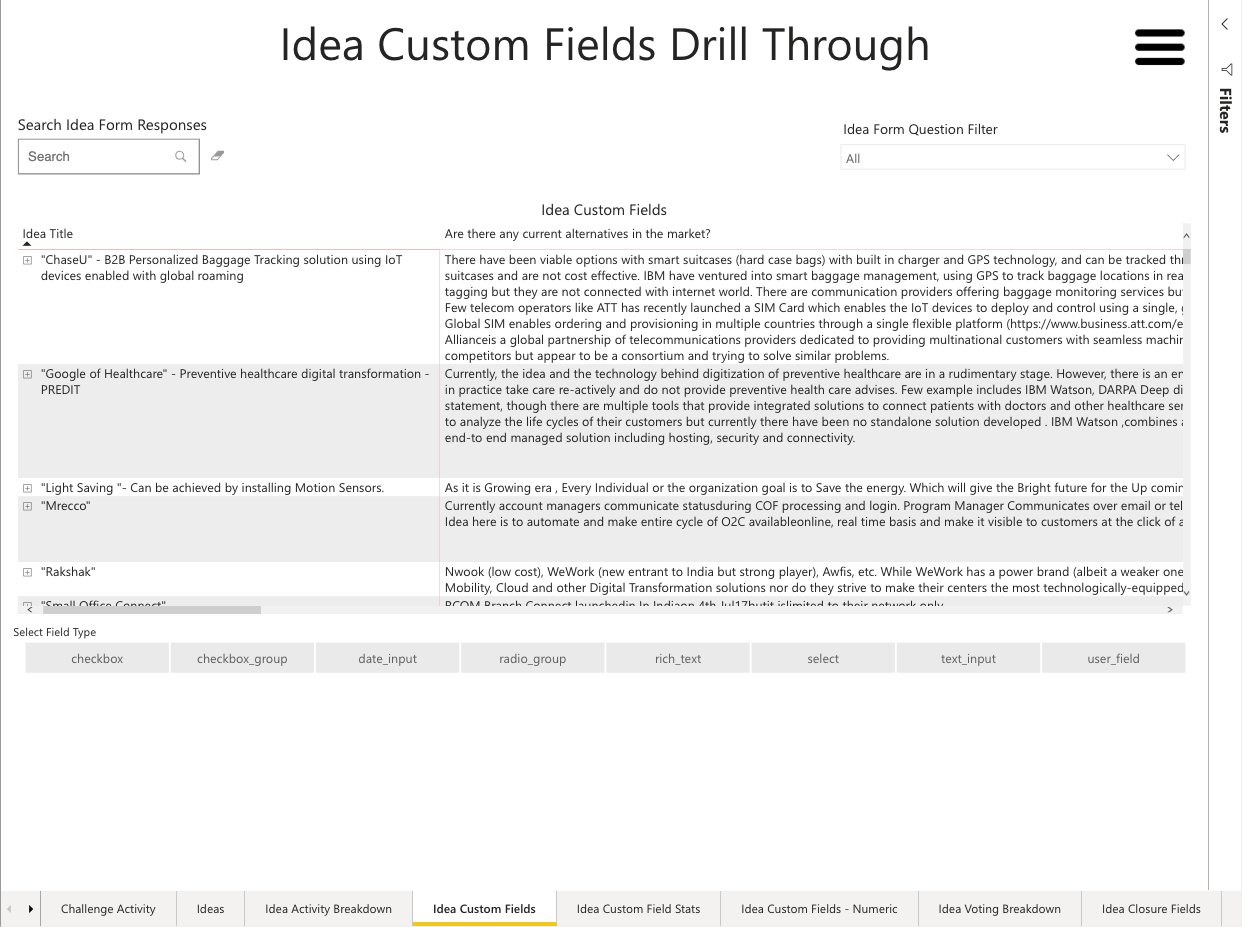
Figure 1 - Idea Custom Fields
Once filtered, the page will adapt and display any question that is present on the idea form. This page provides an easy way to navigate through your custom idea templates without the need to create bespoke dashboards for individual challenges.

Figure 2 - Idea Form Question Filtered by Challenge Title to show only those fields that match
The above screenshot shows the Idea Form Question which is available from the filtering carried out by challenge or community. Selecting one will adapt the visualization below.
The lower section of the tab shows six buttons that refer to the types of question you can place on an idea template. By selecting a button, the visualization above will adapt, allowing you to work with just those question types.
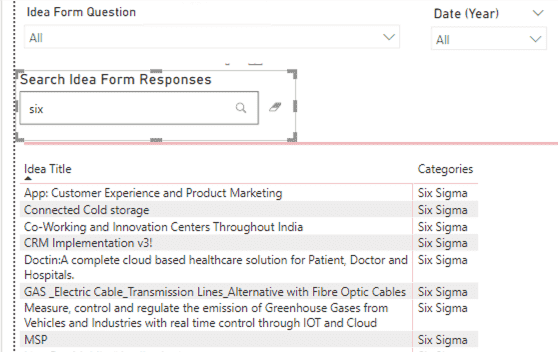
Figure 3 - Field Types Filter Options
This entire visualization is searchable from the Search Idea Form Responses in the upper left corner. The search will look within the fields that are being filtered and adapt the main visualization to only display results. This is tremendously useful as it saves time when presenting data or filtering data and removes entirely the need to export data for searching.
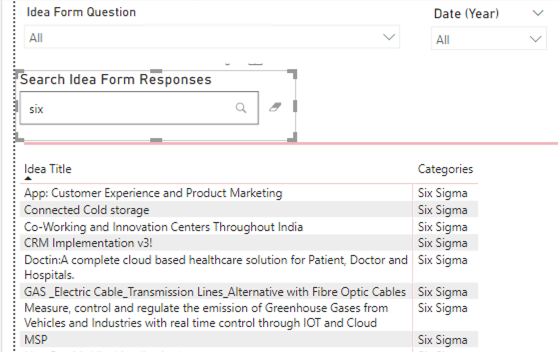
Figure 4 - Searching Custom Fields
When working with "select", "radio group", or "check box group" field types, you can access a preconfigured breakdown of the values associated with a given field. Simply sort the data according to your requirements then right click on the column header for the desired field. This produces a "Drill Through" option. Click Idea Custom Field Stats.
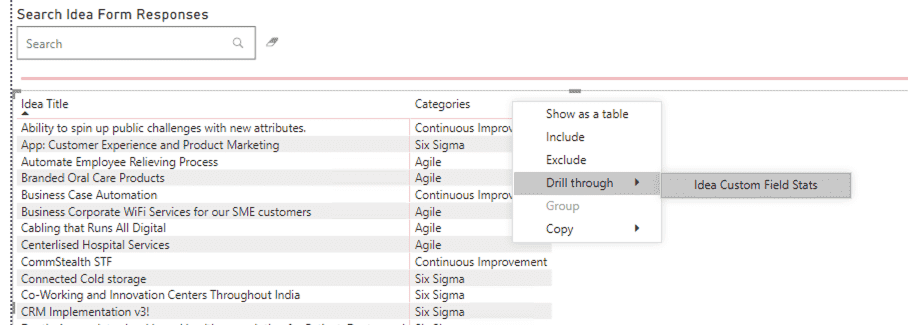
Figure 5 - Idea Custom Field Stats Drill Through Step
Having clicked the drill through, you will then be taken to a new tab which shows visualizations that represent the data you have just filtered. You can access this tab at any time by selecting Idea Custom Field Stats but it will not display values in the visualizations unless you have selected them from the Idea Custom Fields page.
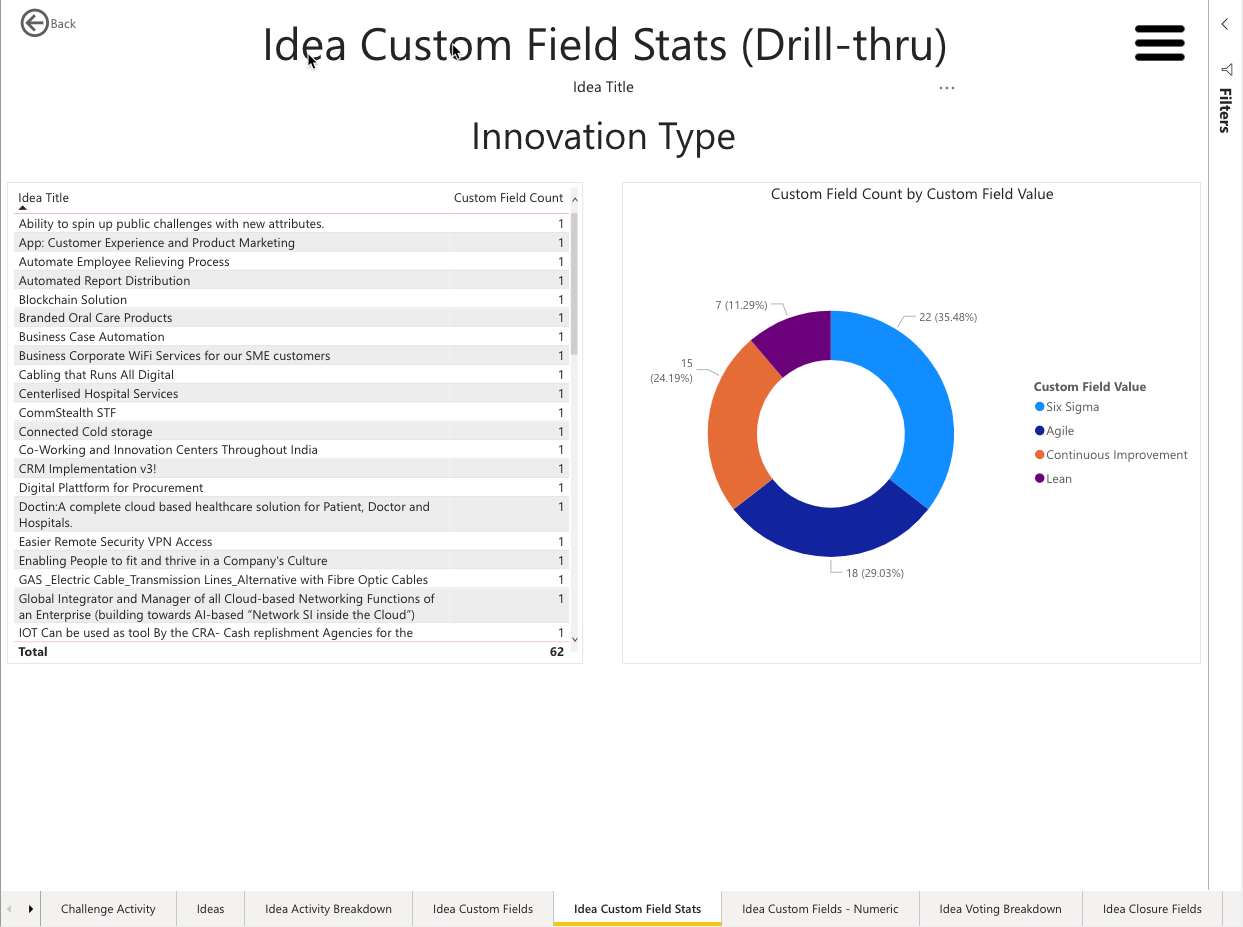
Figure 6 - Idea Custom Field Stats - Drill Through on Category
This tab contains three visualizations which relate to your pre filtering on the Idea Custom Fields page.
Idea Custom Field Label - This displays the column header/custom field label (question) that you have filtered upon. In the screenshot, it displays Categories as an example.
Idea Breakdown – The left visualization displays all ideas that are listed in the donut visualization. The two visualizations interact with each other to filter and display a list of the ideas that match the selected data.
Custom Field Count by Custom Field Value – This donut chart shows the count and percentage of responses on the custom field that you have filtered upon. In this example, we can see a breakdown of ideas by category.

