
Idea Key Themes
Introduction
This visualization leverages Natural Language Processing to cluster ideas using the text contained in their descriptions (idea field labeled Content). Each idea is analyzed and processed using the Power BI NLP capability and then rendered into a cluster visualization based upon the analysis.
The clusters work with the existing filter model and can therefore allow one, multiple or all challenges to be selected to cluster the key themes.
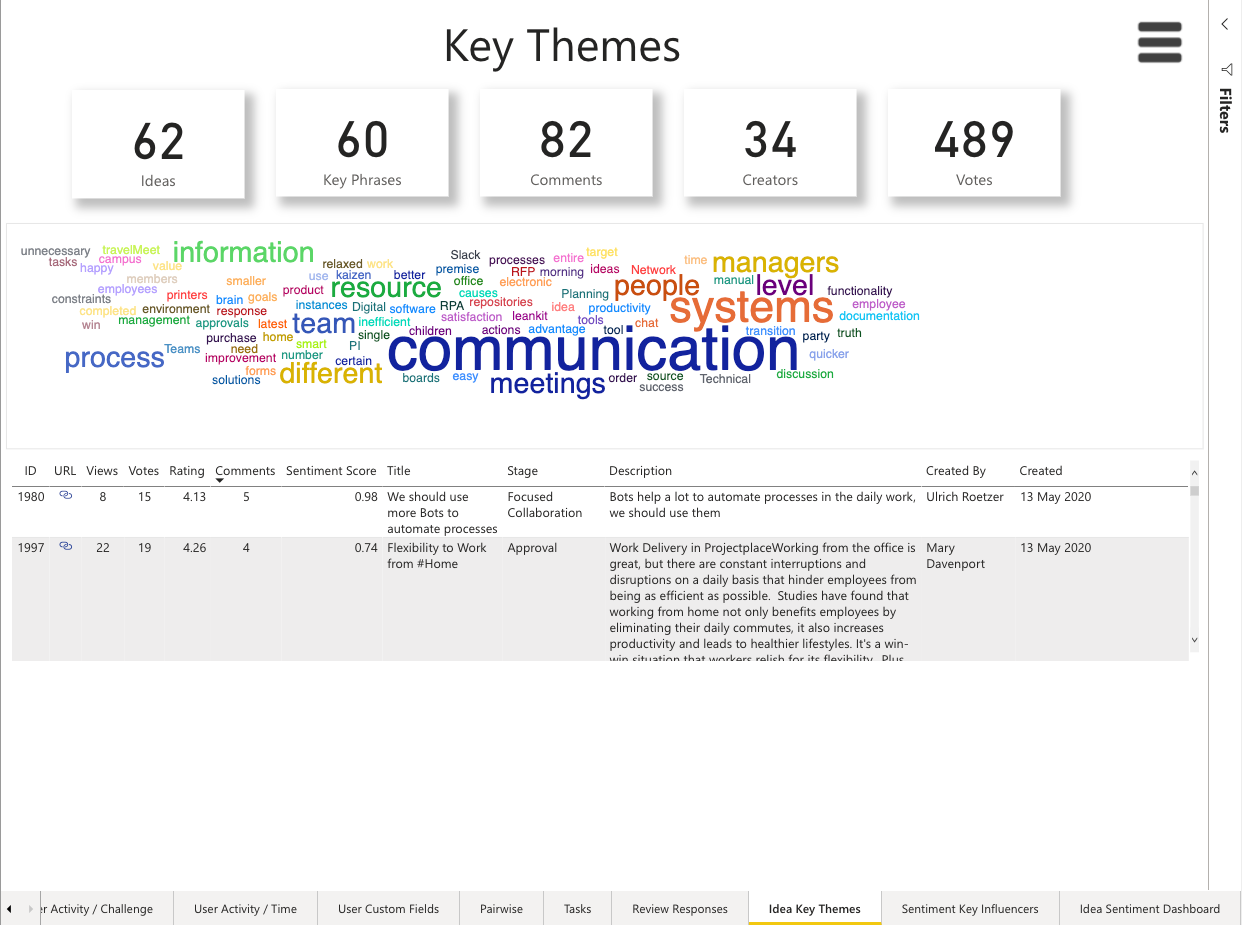
Figure 1 - Idea Key Themes
Visualization Interactions
Clicking a key theme will refine the table below, offering a deeper insight into the key idea details such as ideaID, URL, Title, Description (Content), Created Date and current stage. It also offers a new column named Sentiment.
Idea Sentiment score is a 0-1.0 score that is calculated into a metric using the comments on an idea. To understand more about the idea, simply right click the row and select Drill through and Idea Sentiment Dashboard.
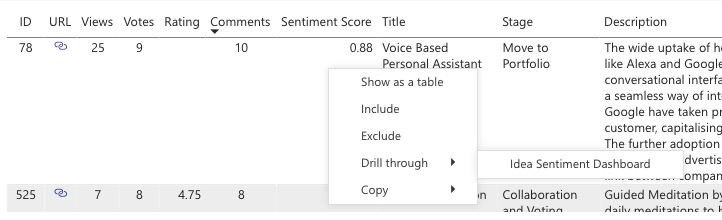
Figure 2 - Visualization Interactions
Logic Note
The Natural Language Processing in use within this visualization is different from the comparable ideas feature which is contained within the application (View Idea Page) The analytics capability is intended to be deeper and therefore leverages a capability that utilizes a broader library from which to identify key themes.
NOTE
The Word Cloud and Text Enhancer visualization options can only be used on the updated SpigitModel or a copy of the updated SpigitModel. Custom reports that existed prior to 12/1/21 will not have those visualization options.