
Custom Fields Values - Updating the SpigitModel
Custom Fields
Custom fields are now available in a pivoted format within five field folders that are contained within the Power BI Embedded interface. These custom fields link to either idea custom fields or user custom fields and are designed to be interchangeable across visualizations within the same report tab or report. Our design principle with these fields is to allow up to ten fields to be added to a report visualization which will allow a download to .xlsx or .csv to be achieved without formatting issues.
Due to the nature of custom fields, we do not plan to ship any standard reports with the model updates. In this article you will discover how you access the fields and then work with them to build visualizations.
Accessing the Custom Fields
Each of the sets of ten custom fields are located in their corresponding folder. In order to add them to any visualization, they must be selected just like any other field and added to the visualization panel. The folder locations are:
- Idea Custom Fields - Ideas
- Idea Creator Custom Fields - ideaCreators
- Idea Commenter Custom Fields - ideaCommenters
- Idea Voter Custom Fields - ideaVoters
- User Custom Fields - Users
These fields are listed in two sections within each folder and each section has 10 items.
CustomValue01-10
This should be used for displaying any value associated with the selected label in each of the fields listed above. Each of these numbered values will display the data entry.
CustomValueCount01-10
This section should be used for "counting" the entries in each label. An example might be that you want to count a number of the idea custom fields and this will allow a count of them to be displayed using a visualization on the tab. These are best used exclusively with the "card" visualization option.
Adding Custom Values to Visualizations - Idea Custom Fields
To add a custom field, there is a process which must be followed. This is the same process for all use cases of the custom values but the label that is used in conjunction with it will change.
NOTE
If you are trying to display idea fields with no data, you must select at least one additional custom field containing data. We recommend you select a required custom field in addition to the fields for which you are trying to report on.
Step 1
- Access Create from the report menu.
- Open the Fields section of the page.
- Access the Ideas folder.
- Select ideaID and ideaTitle to the visualization.
- Ensure that the table visualization is set in the visualization type field.
- Add IdeaCustomValue01, IdeaCustomValue02 and IdeaCustomValue03 to the visualization.
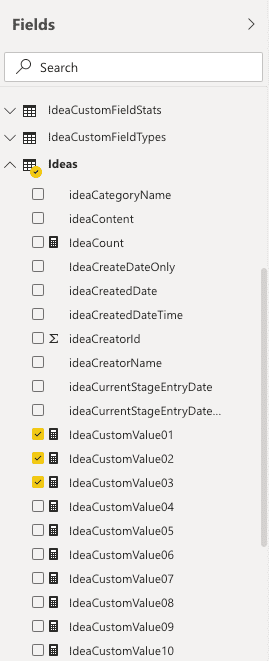
Figure 1 - ideaCustomValue fields in the ideas folder
Step 2
- Locate the IdeaCustomFieldLabels section in the Fields panel. (Figure 2a)
- Expand it and then drag the ideaCustomFieldLabel to the blank space on the report panel. (Figure 2b)
- Keeping the visualization highlighted, ensure the slicer visualization type is selected.
- Note the format on the report changes to visualization.
.png?revision=2)
Figure 2a - ideaCustomFieldLabels that should be used for idea custom field filtering
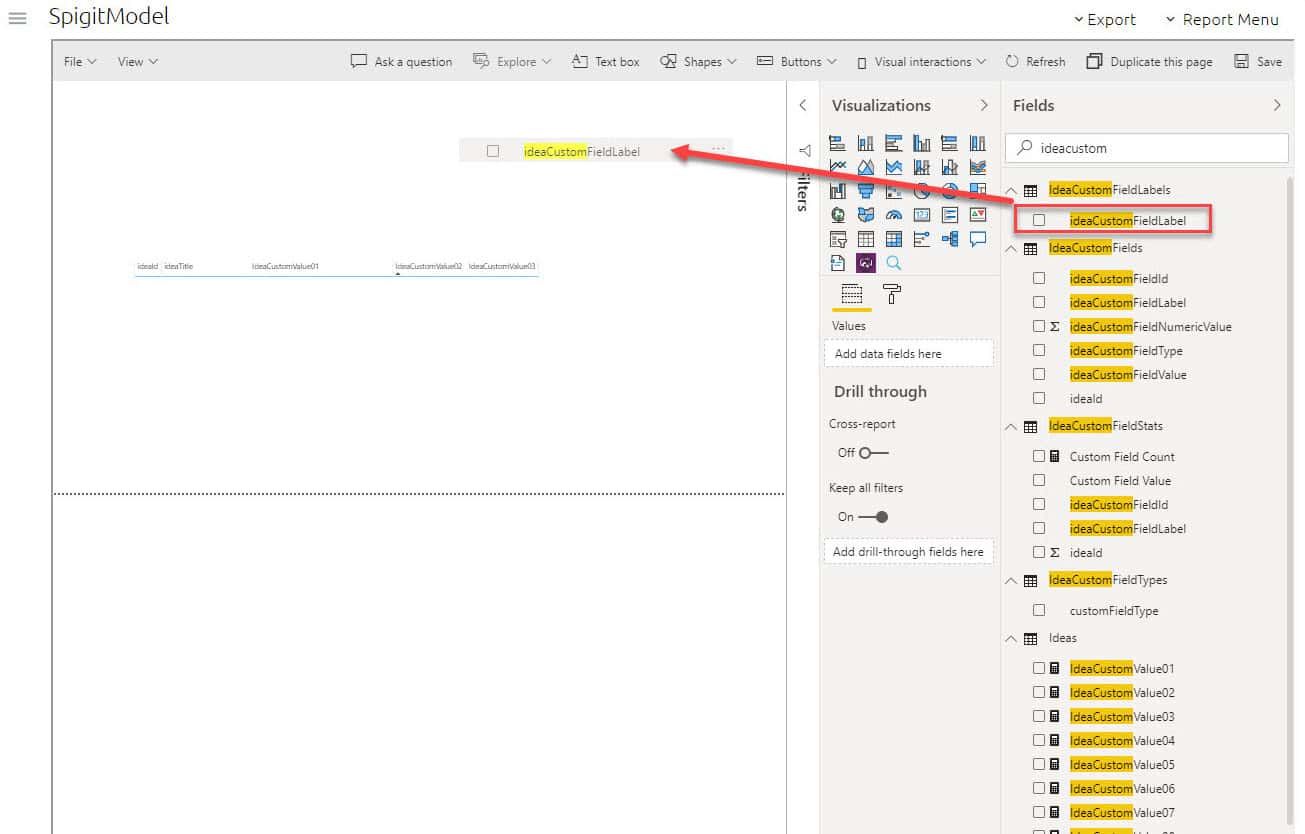
Figure 2b - Drag the ideaCustomFieldLabel to the blank space on the report panel.
Step 3
- You will now see a long list of ideaCustomFieldLabels. This list is all custom fields available in the idea templates, instance-wide. It is not filtered. (You can search by adding the field into the page filter panel and using the text search there.)
- As you add them, note the idea visualization we added in Step 1 is now populated.
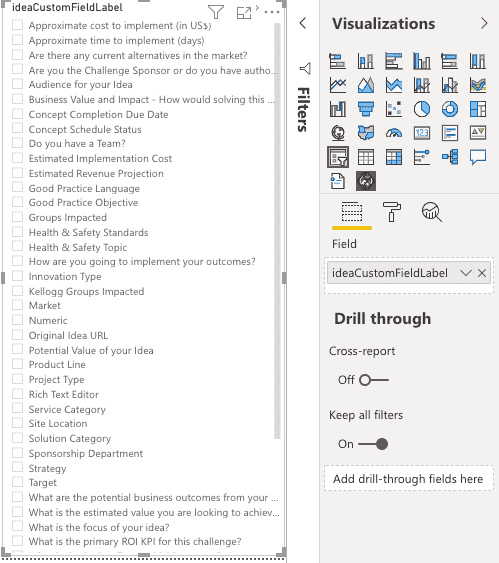
Figure 3 - ideaCustomFieldLabels placed as a slicer on the visualization tab
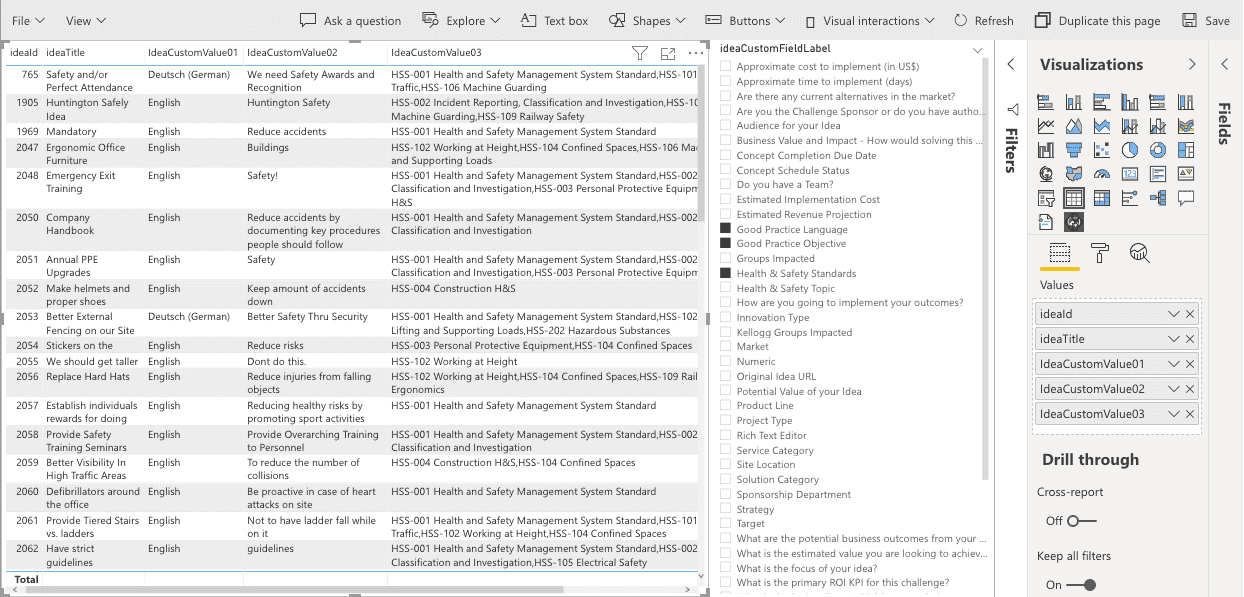
Figure 4 - ideaCustomFieldLabels selected and displaying values on the table
Adding Custom Values to Visualizations - User Custom Fields
To add a custom field, there is a process which must be followed. This is the same process for all use cases of the custom values but the label that is used in conjunction with it will change.
Step 1
- Access Create from the report menu.
- Open the Fields section of the page.
- Access the Users folder.
- Select userID and userDisplayName to the visualization.
- Ensure that the table visualization is set in the visualization type field.
- Add UserCustomValue01, UserCustomValue02, and UserCustomValue03 to the visualization.
Step 2
- Locate the UserCustomFieldLabels section in the Fields panel.
- Expand it and then drag the userCustomFieldLabel to the blank space on the report panel.
- Keeping the visualization highlighted, ensure the slicer visualization type is selected.
- Note the format on the report changes to visualization.
Step 3
- You should now see a long list of userCustomFieldLabels. This list is all custom fields available in the user attributes tables, instance-wide. It is not filtered.
- As you add them, note the user visualization we added in Step 1 is now populated
Adding Custom Values to Visualizations - IdeaCreators, IdeaVoters and IdeaCommenters
These values are all related to the UserCustomField table and therefore all leverage the same approach to adding the CustomValue01-10 to them.
In each scenario, Step 1 and 2 should adapt to the context of the field folder. Step 3 in each scenario should take in UserCustomValue as the slicer.
Step 1
- Access Create from the report menu.
- Open the Fields section of the page.
- Access the IdeaCreators folder.
- Select userID and userDisplayName to the visualization.
- Ensure that the table visualization is set in the visualization type field.
- Add IdeaCreatorCustomValue01, IdeaCreatorCustomValue02, and IdeaCreatorCustomValue03 to the visualization.
Step 2
- Locate the UserCustomFieldLabels section in the Fields panel.
- Expand it and then drag the userCustomFieldLabel to the blank space on the report panel.
- Keeping the visualization highlighted, ensure the slicer visualization type is selected.
- Note the format on the report changes to visualization.
Step 3
- You should now see a long list of userCustomFieldLabels. This list is all custom fields available in the user attributes tables, instance-wide. It is not filtered.
- As you add them, note the user visualization we added in Step 1 is now populated.