
TeamTap5b - Tap Explorer Themes
In a similar way to tab 5a, we are using the layout here to convey levels of activity against Tap key themes and user attribute data.
This cord visualization demonstrates not just user activity but a powerful linking of user attributes such as "location" or "country" and the key themes that are being observed and modeled from Tap Titles.
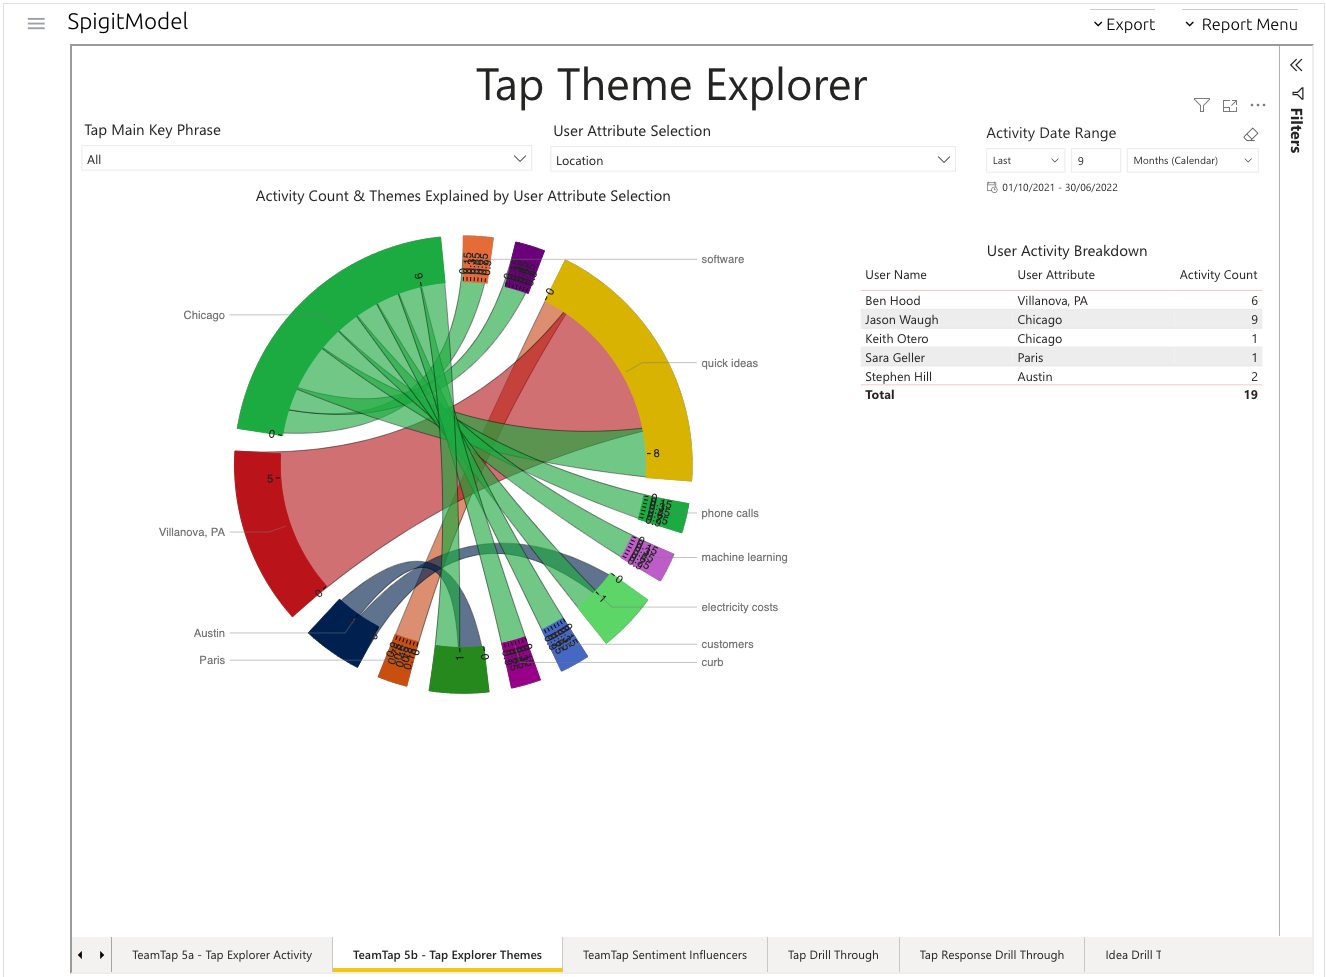
Figure 1 - Cord visualization demonstrating user data drivers for activity by theme
Using this visualization, we can understand the relationships between which locations or departments are engaging with trending themes. In doing so, we can gain an understanding of whether opportunities or issues are localized or potentially spreading across different locations or departments. If we can understand how users interact with trending themes over time, we can start to target engagements through IdeaPlace challenges in those areas or even use the data to discover ideas or options to address the issues before they mature.