
October 2020 PBIX Changes
Introduction
Our October update of the Power BI Embedded IdeaPlace Model adds several new data points, updates some visualizations based upon user feedback, and introduced some iterations to our standard visualizations.
Idea Stage Entry Details
We have now added metrics that track the idea date and stage exposure to the data model. You can locate these in the Ideas folder:
ideaCurrentStageEntryDate – The date of current stage entry displayed as Day of the week, month, day of the month, year (e.g. Sunday, January 1, 2020).
ideaCurrentStageEntryDateTime – The date of the current stage entry displayed as DD/MM/YYYY HH:MM:SS by default.
ideaDaysInCurrentStage – This displays the number of days that an idea has sat in the current stage without movement.
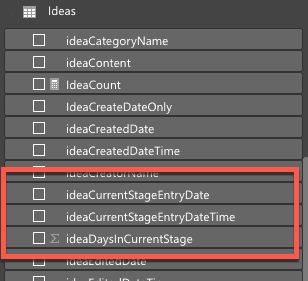
Fig 1 - Idea Stage Data Attributes
Active User Percentage
We have added a new calculation for challenges that displays the percentage of active users against the potential audience size. This is located in the ActiveUsers folder:
PercentageOfAudienceActiveUsers - This represents the percentage of active users in the challenge based upon the audience size.
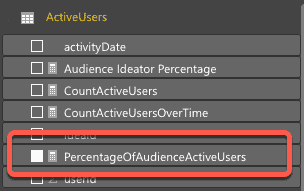
Fig 2 - Audience Calculation
Visual Tooltips
Based upon user feedback, we have introduced visual tooltips to the metrics located on the Challenge Activity tab. This introduces the calculation and explains how it is being built. The following tabs now have these tooltips:
Challenge Activity – Audience Size, Visitors, Active User %, Active Users
Ideas – Ideas per stage
Idea Custom Fields – Idea Custom Fields Table
Idea Custom Field Stats – Drill Through Header
User Custom Fields – Global User Report

Fig 3 - Visual Tooltip Example
Updates
Pairwise – We have amended the Pairwise voting breakdown to ensure that it shows the correct ranking for ideas that have been entered into the Pairwise phase. Please note that this will show the final ranking only once the phase has closed in the challenge within the app and a data refresh has been concluded. Until that time, it is the current Wilson calculation and may differ from the table observed in the user interface.
Pairwise – The voting visualization has been removed following user feedback.
User Activity – Based upon feedback we have removed the User Created Date from all of the user activity visualizations on the tab.
Fixes
Idea Closure Fields & Numeric – These two tabs have been corrected to remove a typo that had been observed.
Idea Custom Fields & Stats – Following reports of issues with drill throughs to this page causing errors, we have corrected the behavior. The report drill throughs will now interact fully on the Idea Custom Field Stats tab and will filter correctly on the selected challenge or community.
NOTE
The drill through will work for all field types apart from: checkbox, date_input, numeric, numeric_input, rich_text, text_input and user_field by default. This is due to the data lacking standardization in the question format. Should you wish to adapt this, please copy the visualization and update the filters accordingly before saving your own version.