
Reporting - Planview IdeaPlace Analytics Embedded Solution
Introduction
The new Power BI analytics solution is something that we are tremendously excited to have in our application. Power BI offers a strong set of out-of-the box capabilities to you, allowing for increased flexibility, deeper insights gathering and an enhanced user experience, all of which were key to us making the decision to migrate. Specifically, this change delivers advanced analytics features such as natural language processing and sentiment analysis.
Like our previous embedded reporting solution, the Power BI embedded feature is branded as Insights within the Planview IdeaPlace application.
Where Can I Access Insights?
The embedded Power BI solution is located, by default, within the Dashboard tab of any challenge or community in the application. The page is set as a sub tab and named Insights in all instances by default.
What Role Do I Need to Access Insights?
There are two roles which are required to be held by a user in order for them to work with Insights.
Report Analyst - The Insights page will be visible to users holding the Report Analyst role by default. This means that users who currently hold the role will not have to have their permissions amended in order to view reports.
Please note, the Report Creator will need to be added to each challenge or community within which access needs to be granted.
Report Creator - A new role will be made available for assignment that, once granted, will allow a user to both access the Insights page and create, edit and save reports within the page.
The Report Creator role will be automatically assigned to any user holding the Super Administrator role. This role also allows Super Administrators to manage Insights across all challenges and communities.
It is important to note that challenge and community level Administrators will not be assigned Report Creator by default. They can, however, be assigned the role at any point, and this will allow them to create, edit and save reports using Insights.
NOTE
The Report Creator will need to be added to each challenge or community within which access needs to be granted.
There is also a third role that's required in order to access the Tableau and OData Connectors:
External Report Author - In order to authenticate to the Web Data Connector, each user must be assigned the External Report Author role within their IdeaPlace instance. This role is not available by default and will require a customer care ticket to be submitted in order for it to appear in your user management section of Power BI Desktop. See more information here.
Working with Insights
Terminology
Workspace – The workspace is the term given to each Insights area within the IdeaPlace application. Only one workspace can exist within one IdeaPlace application.
Folder – A folder exists uniquely within a workspace. Each folder can house multiple reports, both standard and custom.
Report – A report represents a group of visualizations that can be spread across multiple tabs inside of Insights.
Visualization – A visualization is a single data representation that can be placed on a tab inside of a report. These can take on familiar forms such as tables, donut charts, KPI’s etc.
File System
The new analytics feature includes an embedded report building solution which allows any user holding the Report Creator role to create, edit and save any reports and dashboards from within the IdeaPlace application.
This capability is joined to a new file storage UI that operates within each of the Insights workspaces in IdeaPlace. You can access these file storage areas with both the Report Creator and Report Analyst role. However, only the creator role is permitted to create new folders, edit folders, and save any custom reports or dashboards from within IdeaPlace. The file structure user interface is accessed directly from the Insights page.
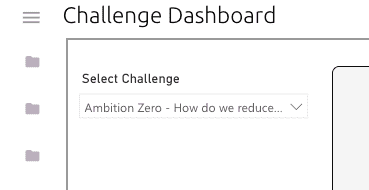
Figure 1 - File System User Interface - Hamburger Menu
Clicking the Hamburger menu (three stacked lines) opens up the folder navigation section. This area contains the standard folders that are delivered with the Insights feature. As users build out reports and visualizations, they can be added to the folder structure through a management panel which appears on the drop down in the Report Menu.
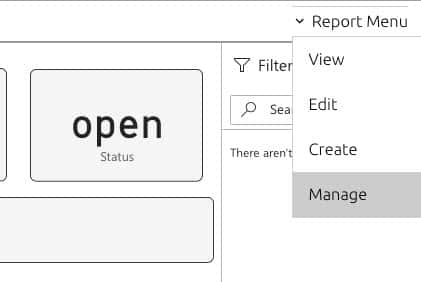
Figure 2 - Manage Option in the Report Menu
The management option takes the user into the main file and report management page. On this page, all reports and visualizations can be added to existing or newly created files for easy access in the future. Visualizations must be saved on a report in order to be managed in this way.
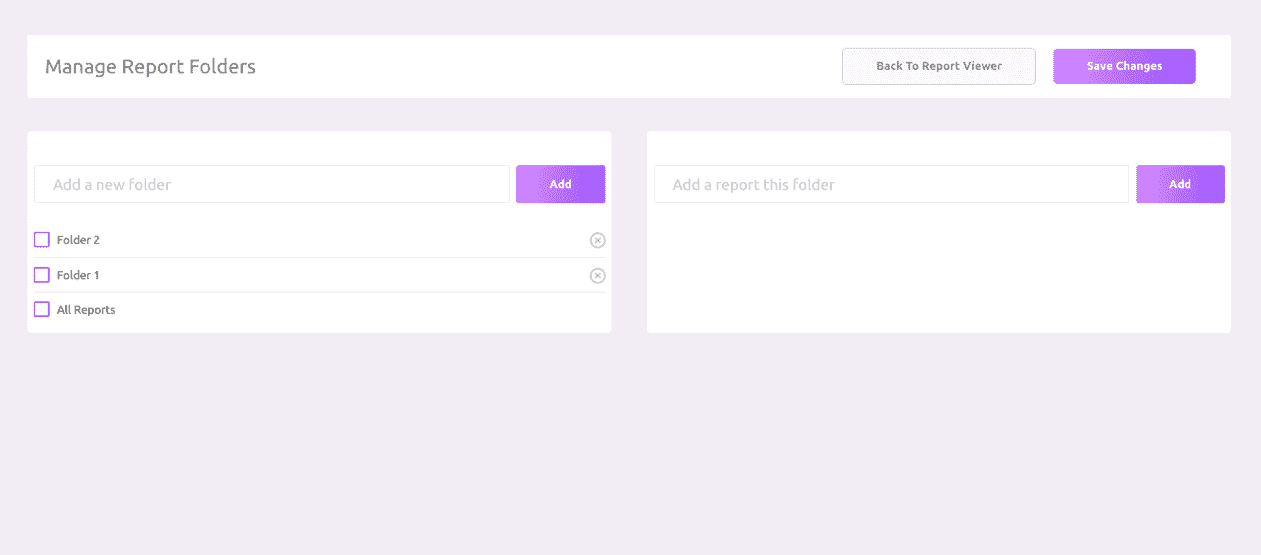
Figure 3 - Folder Management Panel
The panel is split into two clear sections. The left side is for folder management (creation and removal) while the right side is used to access reports and add them to the folders contained within the left panel. All reports that have been created in the workspace by any Report Creator will be visible in the Add a report to this folder.
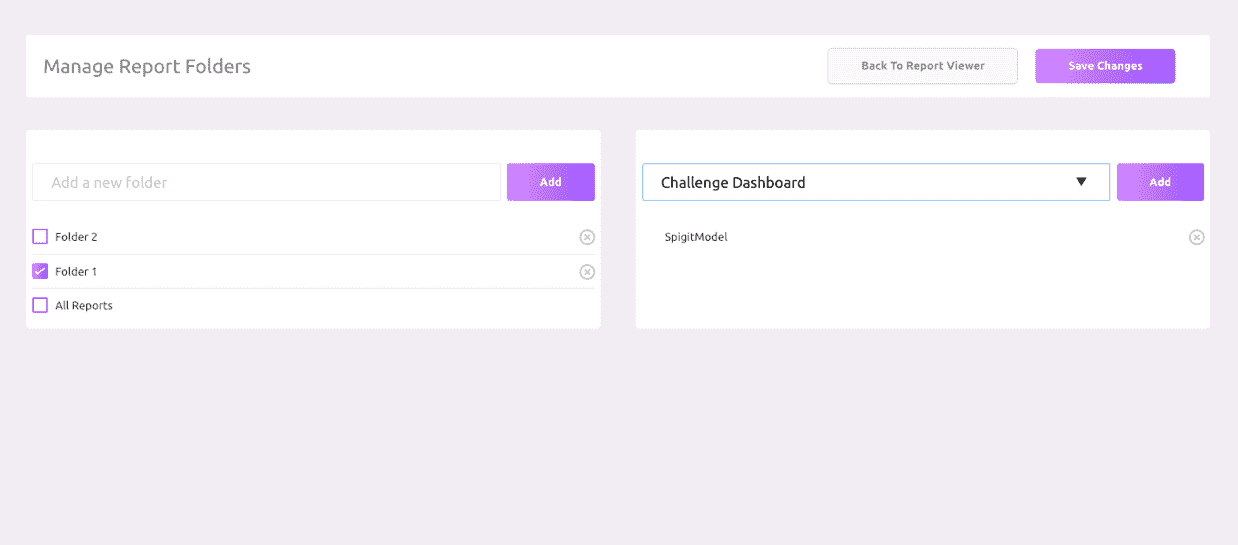
Figure 4 - Expanded Reports Menu
Clicking the Add a report box will show all reports available through a drop down. Typing characters into the box will also match any report names that are available and suggest them in the same drop down. To add the report to a folder, simply select the folder on the left-hand side by checking the box (Figure 4) and then clicking Add on the right-hand panel. The report will now be saved in the folder that was selected.
To add a folder to the interface, simply enter your desired folder name in the left panel and click Add. The folder will now be available in the list below. Any custom folders that have been created in the workspace will be denoted by the X box, which indicates that they can be removed. To delete a folder, click X. If a folder is deleted, it will not delete any reports contained within it. They will remain accessible through the All Reports folder, which cannot be deleted.
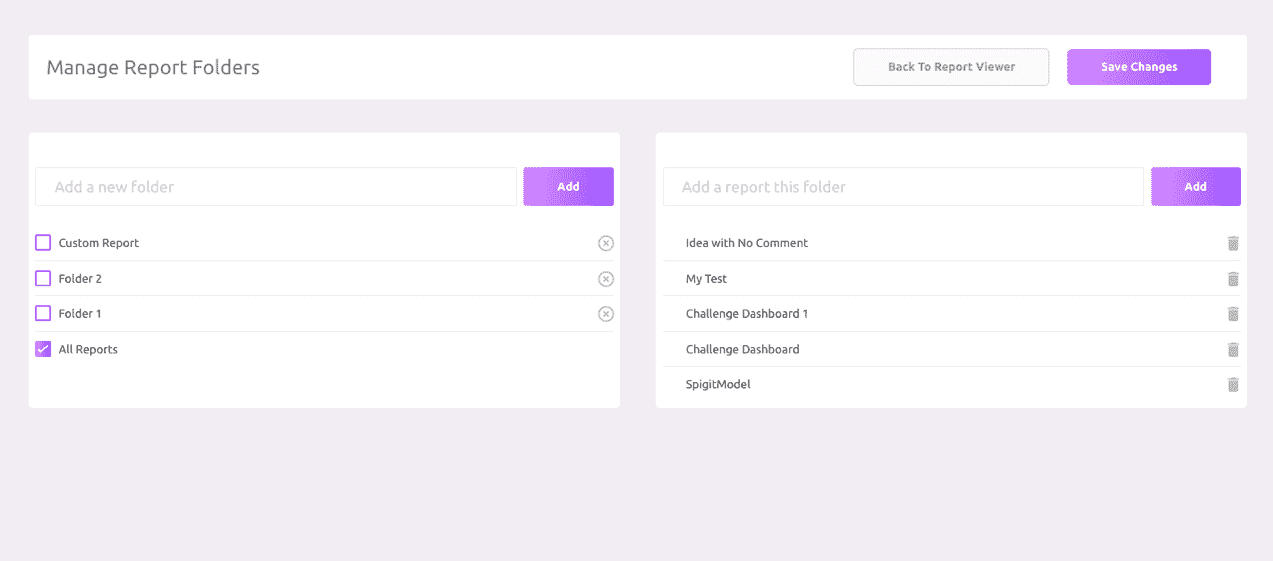
Figure 5 - Viewing Reports in Folders
To access a folder, select it from the left-hand panel by using the check box. Once a folder is selected, the report view on the right-hand side adapts to display the contents of the selected folder. This view shows additional options to delete reports contained within the folder.