
Work with Portfolios
Click the tool selector  in the top navigation bar and then click Portfolios to open the Portfolios tool. From here, you can create new portfolios and manage KPIs, in addition to viewing information about the status of each portfolio and the project workspaces within them.
Portfolio Overview
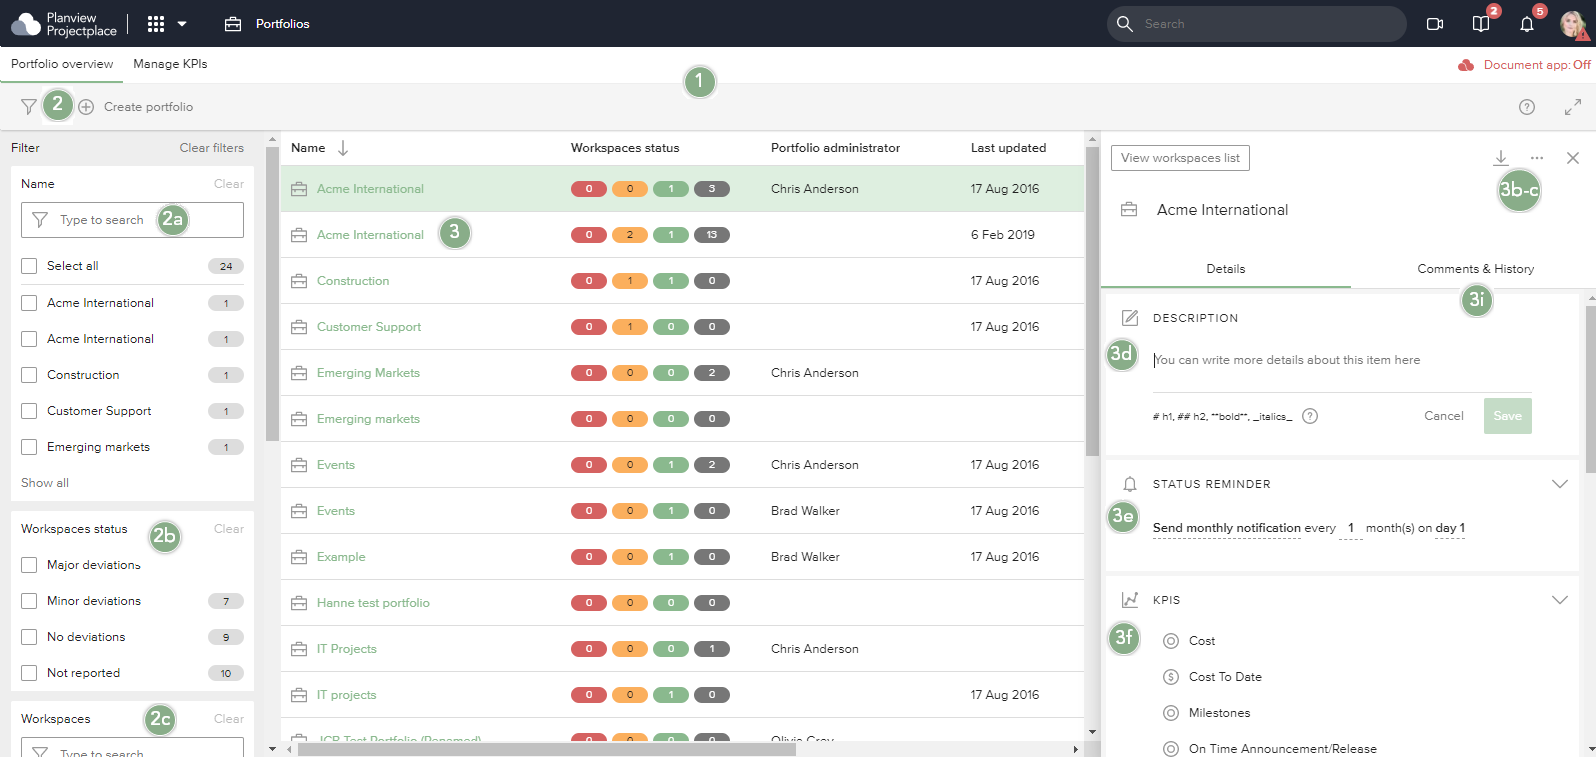
Example of the Portfolio Overview screen
- The Portfolio Overview contains a list of portfolios reported from the project workspaces and displays status summaries for each portfolio. This view is useful when you want to know those portfolios that are performing with deviations, those that are at risk, and those that are performing according to plan. For the multi-colored icons to indicate the number of workspaces that have deviations the portfolio administrator must have added one or more Status KPIs to the portfolio. The multi-colored icons will show one of the following status options:
 Green indicates work is being accomplished according to plan. This is also referred to as work that has no deviations.
 Amber indicates a slight deviation or risk for deviation away from the plan. This is also referred to as minor deviations.
 Red indicates a major deviation from the plan.
  Gray indicates that status has not been established at this time. This is also referred to as not reported.
- Click the screen's filter icon
 to apply one or more filters that narrow down the list of portfolios that are displayed. The following filters let you customize which portfolios appear:
- Use the Name filter to select one or more portfolios to view.
Type to search for a specific portfolio name and select it from the available list. Repeat the process for all portfolios you want to use.
- Use the Workspaces status filter to narrow down the list of displayed portfolios by those that have workspaces with Major deviations, Minor deviations, No deviations, or Not reported.
- Use the Workspaces filter to narrow down the list of displayed portfolios to only those with the workspaces you specify.
Type to search for a specific workspace name and select it from the available list. Repeat the process for all workspaces you want to view.
- (Not pictured) Use the Portfolio administrator filter to narrow down the list of displayed portfolios by their administrator.
- (Not pictured) Use the Last updated filter to specify a date range for when the portfolios you want to see were last reported.
- Use the Name filter to select one or more portfolios to view.
- Click on a portfolio's row to view its details without having to navigate away from the portfolio overview.
- Click the Portfolio icon
 to open the single portfolio view, which contains specific details including the complete status for the workspace.
 - Click the Export portfolio report icon
 to get a portfolio report in Microsoft Word.
 - Click the More icon
 and then Delete portfolio from the dropdown menu to Delete a portfolio.
 - In the Description section
 you can add more details about the portfolio.
 - In the Status reminder section
 , the portfolio owner can set up a reminder to update the status which is sent to the workspace manager, to ensure the information in the portfolio is current.
 - In the KPIs section
 , click the plus icon
to add additional KPIs to the portfolio.
-
In the Workspaces section, use the Add workspace menu to add additional workspaces to the portfolio. Workspaces included in the portfolio are listed below, and directional trend arrows indicate the reported status for KPIs and the change from the previous status report. The trend is calculated by comparing the most recent reported KPI status with the previous status reported 7 days before the reported last status.
 Positive trend: From Red, Amber, or Gray to Green
 Positive trend: From Red or Gray to Amber
 Negative trend: From Green or Gray to Amber
 Negative trend: From Green, Amber, or Gray to Red
 No change. Everything is going according to plan.
 No change. A slight deviation or risk for deviation.
 No change. Major deviation from the plan.
 A status has not yet been established.
- Click the Portfolio icon
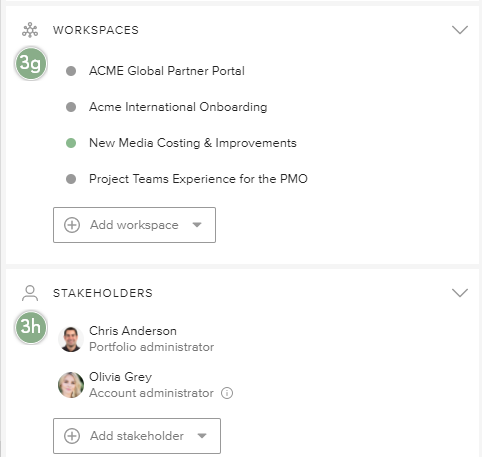
Example of the lower part of portfolio detail pane on the Portfolio Overview screen
h. In the Stakeholders section, click the plus icon to add stakeholders to the portfolio via email, or select them from a list if they are already workspace members.
i. Use the Comments & History tab to discuss the portfolio and its included projects with other stakeholders and view the portfolio history.
TIP
Click the column headers to change sorting parameters, making it easier to compare portfolio data.
Single Portfolio View
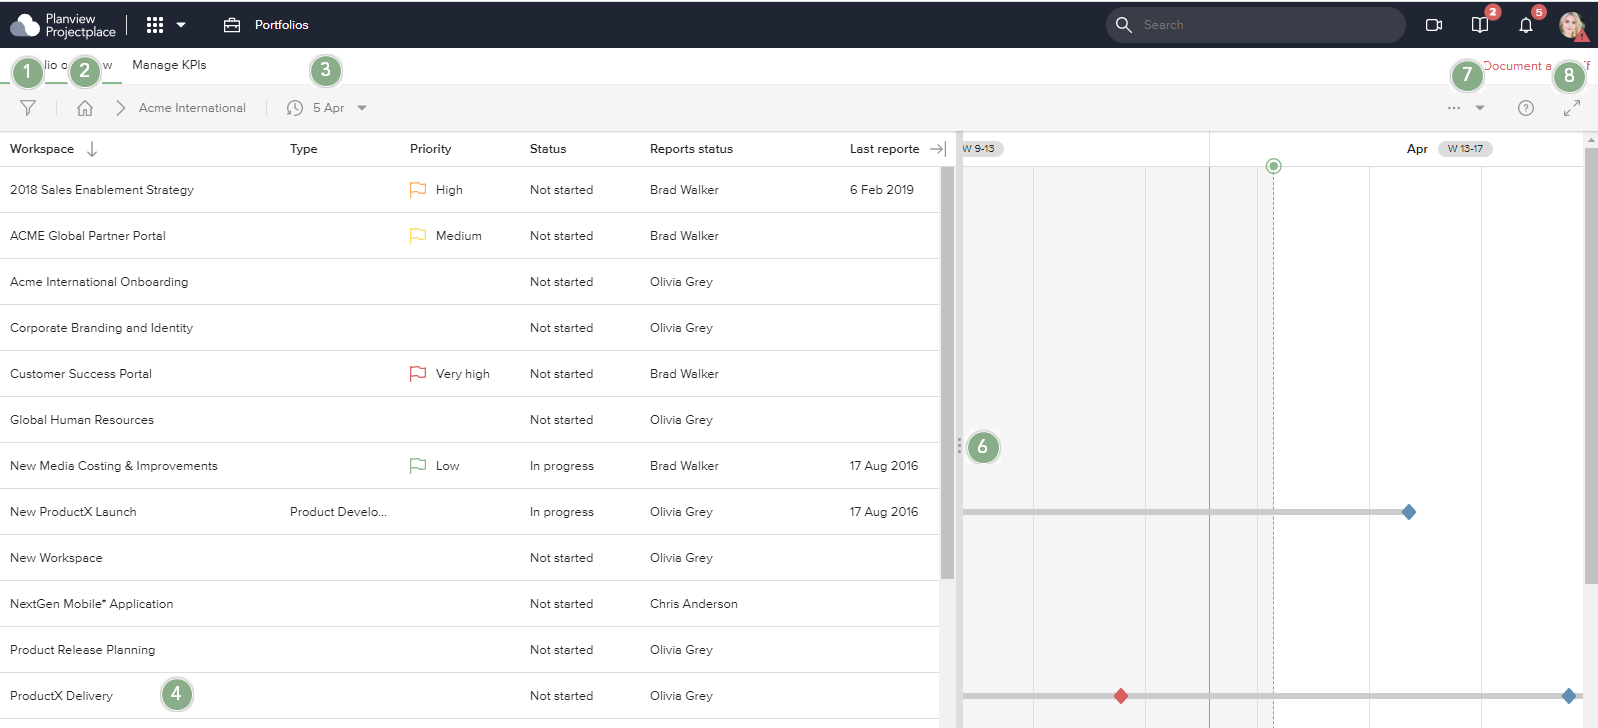
When you click on a portfolio from the Portfolio Overview, you will see a single portfolio view which contains a list of all workspaces associated with the portfolio, and a schedule that displays important milestones for each workspace.
The color of the milestone icon indicates the status:
 Green: milestone was accomplished on time
 Blue: milestone is upcoming
 Red: milestone has been delayed
- Click the Filter icon to open the filter pane, where you can narrow down the list of workspaces by any of these attributes:
- Workspace
- Status
- Priority
- Reports status
- Last reported
- The breadcrumb navigation allows you to see which portfolio's workspaces you are currently viewing. Click the Home icon
 to return to the portfolio overview screen.
 - The Date picker allows you to select a date to review what the reported KPIs were for the portfolio in the past. (Workspaces that weren't included in the portfolio at the time of the selected date are still listed, as the Portfolios tool does not take this into account. The same is also true for when exporting the view to Microsoft Excel.)
- Click a workspace name to open the workspace detail pane. The detail pane includes an overview of all information reported from a specific project workspace.
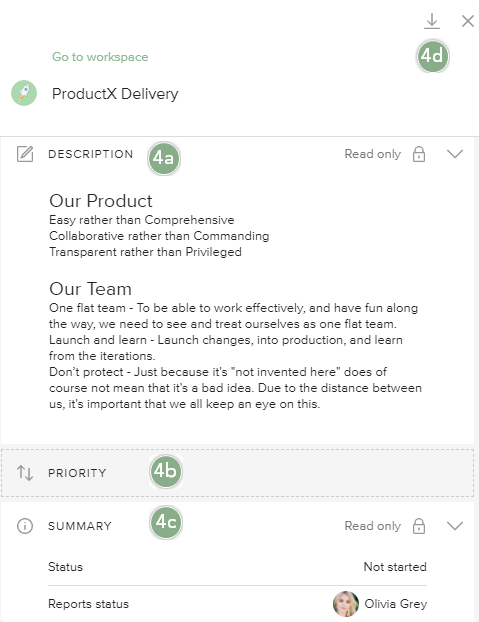
- The Workspace Description can be edited by portfolio owners.
- Click on the Priority section to choose a flag from the dropdown menu ranging from very low to very high.
- The Summary section includes Report status, Last reported, and dates for Current, First, and Last milestones..
- Click the Download icon to download the workspace report.
- Use the scrollbars at the bottom of each pane (not pictured) to view additional information, depending on the size of your browser window.
- Resize the list or schedule viewing areas by clicking and dragging the handle
 in the vertical separator bar to the right or left.
 - Click the Options menu
 to access the following options:
- Export to Excel generates a portfolio report in Microsoft Excel to share with stakeholders.
- Export portfolio report generates a portfolio report in Microsoft Word to share with stakeholders.
- Print schedule view opens a dialog from which you can select the date range and paper size for generating a printout of the schedule view in PDF file format. The schedule view is fit to one page width, and the timeline is dynamically adapted to show weeks, months, or years, depending on the selected date range and paper size.
- Show portfolio details opens a detail pane for the portfolio the workspace is associated with.
- Customize list view gives you the ability to reveal or hide columns and rearrange their order with drag and drop functionality, adjusting the view to suit your needs. These changes will affect all users.
- Click the Full screen icon
 to hide the top-level menu.
TIP
Click the column headers to change sorting parameters, making it easier to compare workspace data.