
Follow-up on Work Progress
There are a number of ways you can stay updated with the progress of work in ProjectPlace—on different detail levels and just when you need it.
Weekly Email Update
You can choose to receive a weekly update by email to conveniently get an aggregated view of the status.
Team Progress
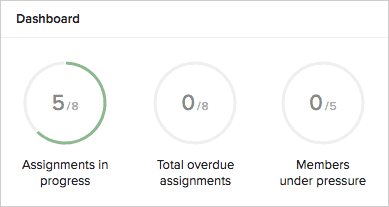
In the Team overview, you can follow up on the progress of your team in the Dashboard, where you can see the total active and overdue assignments, as well as the members’ workloads.
Card Progress
The most basic way of monitoring progress of work is to see which cards are in which status column on a board. If you need more details, you can look at the discussions and history in the card detail pane.
Using Zapier, you can set up a notification when cards are put in a specific status column, for example when cards are done.
Activity Progress
Plan Tool
Progress on activities is displayed in the Plan tool as a status bar, which graphically represents the number of cards that are done in relation to the total number of cards that are connected to the activity.

TIP
A warning is displayed for an activity when the end date of an activity has been reached but there are still cards to be done, which makes it easy to recognize problem areas. Activity warnings are also included in the weekly email report to provide an aggregated update.
You can also follow up on time reported on the activity.
Roadmap Tool
In the Roadmap tool, you can follow up on the overall progress on an activity in the Status attribute of the activity detail pane. The status In progress means that someone has started to work on at least one card in the activity, and Finished means that all cards connected to the activity are done.
NOTE
The ability to create new Roadmap workspaces has been temporarily suspended; however, existing Roadmap workspaces will continue working. No further development will be done to ProjectPlace Roadmap.
Board Progress
A number of charts provide various insights about the progress of all cards on a board, which is useful for example, if a team uses a board for all work to be done during a specific period of time.
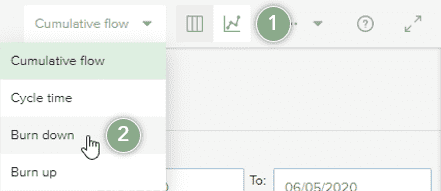
- Click the chart view icon
- Select any of the available charts to open and review.
Learn more about the different type of charts.
Workspace Progress
Workspace Overview
The workspace overview provides an overview of the progress in the following ways:
- Milestones section – shows the upcoming important dates and warnings for overdue milestones.
- Dashboard section – shows information on work that has not been done in time. It also includes the number of cards that are not connected to an activity and which therefore cannot be followed up on the activity level. To see a number of different charts and get detailed insight into progress for all cards currently visible on boards in the workspace, click the charts icon
 .
. - Recent documents tab – lists the documents that were added or changed using the Documents tool within the previous 10 days. The list includes the name of the document that was added or changed, the type of change made, who made the change, and when the change was made.
- Ongoing activities tab – provides insights into how far the ongoing work has progressed, and which activities are overdue.
- Scheduled work tab – provides an overview of the upcoming workload for the team by listing all cards that have a due date or are connected to an activity being executed on a board, and all existing issues and meetings.
You can also choose to receive the weekly update by email.
TIP
In Portfolios, you can create groups of project workspaces that contribute to the same goal so that you have an overall view of their status so that problems can be detected and resolved at at an early stage.
Workspace Reports
Click the following link to see Workspace Reports and Charts
Follow Up on Time Usage
The Plan tool provides more details on the time used. You can also create Excel reports in the Time reporting tool.
Time Usage Information in the Plan Tool
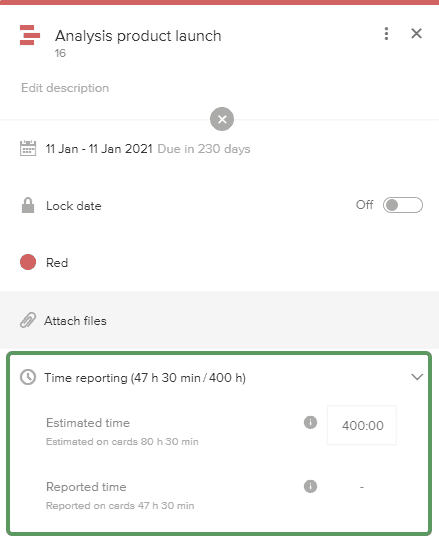
In the Plan tool, you can see the Reported time and Estimated time in the activity detail pane. The Reported time is the sum of time reported on the activity, and on cards connected to it. For a parent activity, the time on the sub-activities is also included. The Estimated time can be set for an activity. For a parent activity the estimated time is the sum of time estimated for all sub-activities.
NOTE
It is not possible to report time on a parent activity, but time reported on the activity before any sub-activities were created is included in Reported time.
TIP
If you want to keep track of how much time it is left until the activity is complete, you can continuously update the estimation instead. The changes to the estimated time are tracked. When you select the Show history check box in the activity detail pane, you can go back and see what the initial estimate was.
TIP
Some of this information is also included in the weekly update sent by email.
Export Time Reports to Excel
Click the following link to see how to Export Time Reports to Excel.
Power BI Integration
With the ProjectPlace content pack for Microsoft Power BI, you can visualize ProjectPlace data in entirely new ways. The out-of-box reports and dashboards provide key statistics that allow you to visualize progress, find bottlenecks, and identify at-risk activities.
Share Progress and Status with Others
There are a few different ways of sharing progress and status with stakeholders.
- Share a link to the public Reports page where you can communicate progress and other information.
- Put project workspaces in a portfolio, add stakeholders to it, and update status regularly to give them an updated view of the status.
- If your workspace is connected to a portfolio, you can also download a project status report from within the workspace to spread to stakeholders.