
September 2021
English | Deutsch | Svenska | Français
September 1, 2021
Milestone Popover in Portfolio Schedule View
We have brought back the Milestone popover that shows details about the name and date for the milestone when you hover over it in the Schedule view.
For more information, visit Work with Portfolios
September 8, 2021
Request information in OData for Power BI
The OData set for Account administrators has been updated to also include information related to Requests. There are two new tables: Requests and RequestCustomFormFields that can now be used for reporting on the request intake in the account by Account and Request Administrators.
For more information, visit Visualize Your Projectplace Data Using Power BI
Increased limit for number of Custom Fields
The limit on the maximum number of custom fields that can be created for each artifact type (Cards, Activities or Documents) in a Workspace has been increased from 10 to 20.
For more information, visit Manage Custom Fields
September 15, 2021
Documents list view update
- We have added Custom fields and Tags to the documents list view for the user to categorize and identify documents easily. These two columns can be hidden or rearranged from the setting options in Documents tool bar inside 'Customize view'.
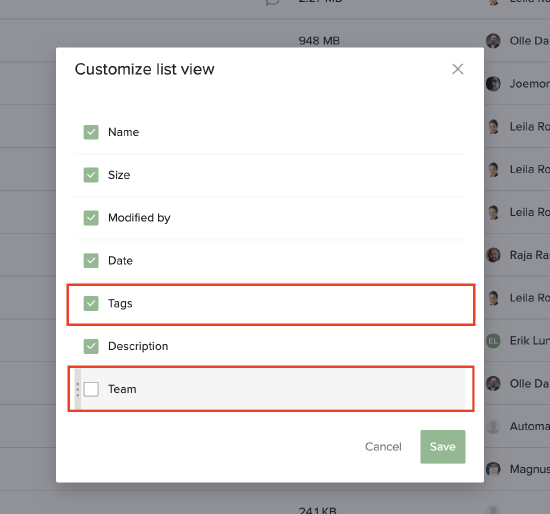
Note: With this update all the previous customizations will be reverted to default for all users.
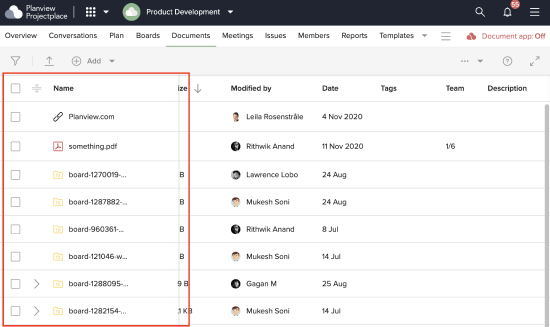
2. We have also made the first column 'Name' in the list view as a fixed column in case of horizontal scrolling to help users track the connection between the document and the various attributes in the list view columns.
For more information, visit Work with Document Tags and Manage Custom Fields
September 22, 2021
More widgets for the Workspace Reports
We are introducing a new set of widgets that focus on deviations in the workspace:
- three separate widgets that show how far off overdue activities, milestones or cards are compared to the original plan.
- three separate widgets that show by how much completed activities, milestones or cards were delayed compared to the original plan
- one widget that displays summary information on number of cards: blocked cards, cards without due dates or estimated time, cards that do not belong to any activity
These new widgets can be found in the widget library of the Workspace Reports page, accessible when customizing the page.
For more information, visit Workspace reports
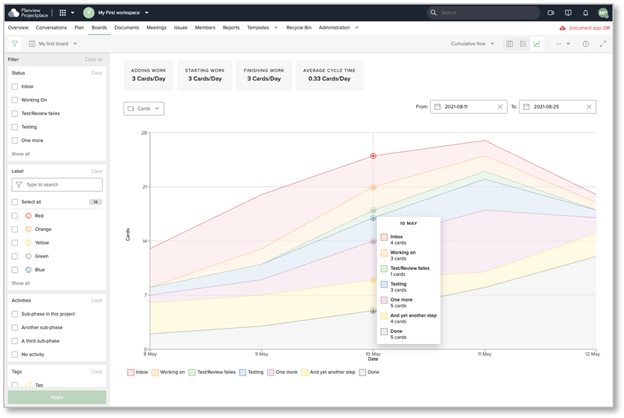
Updated Cumulative Flow Chart for Boards
We've made the following enhancements to the board Cumulative Flow chart:
- Graphical uplift
- Extended card history data beyond 90 days
- More filter options in addition to the current date range input
For more information, visit Cumulative Flow Charts
September 30, 2021
Updated Portfolio Overview with added Filter section
We have updated the Portfolio Overview and added two more columns to the list view containing Number of workspaces in each portfolio and information on whether or not a Status reminder is being sent out to the workspace managers to update the status of the KPIs in the portfolio. We have also added a filter section to enable filtering of the portfolios in the list based on for example Portfolio owner or included Workspaces.
For more information, visit Work with Portfolios
Updated access rights settings to the Workspace Reports page
We have made the Workspace Reports page available in read-only mode for all workspace members by default. It possible for the Workspace Administrator to restrict access to the Reports page to other members of the workspace by changing the access settings under Administration > Tools.
For more information, visit Setup access to Tools