
Speed (Cycle/Lead Time and Process Control)
In AgilePlace, the Speed Report shows the average amount of time that a card takes to be processed from a specified start lane(s) to a specified finish lane. It also provides a mechanism for monitoring variability within a system while identifying systems that are "not in control," i.e. not within acceptable limits of variability. This report is generally used to calculate the amount of time that work items take from the time that they enter the work in progress until they are complete.
Here you'll learn how to:
View and Understand the Speed Report
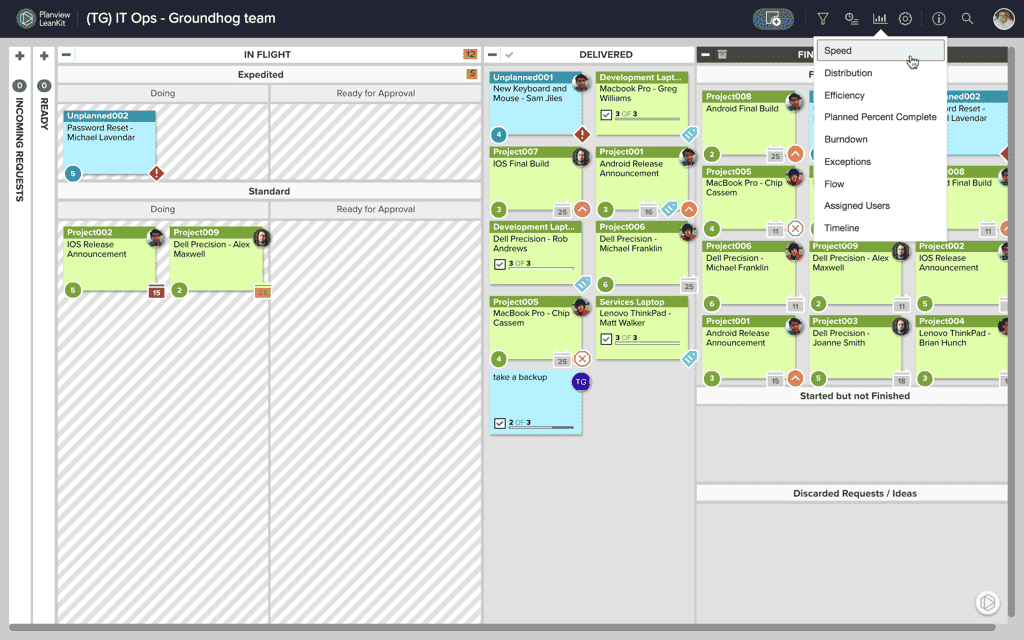
To access this version of the Speed Report on your AgilePlace board, select the chart icon in the upper right side of the top bar, and then select Speed from the dropdown menu.
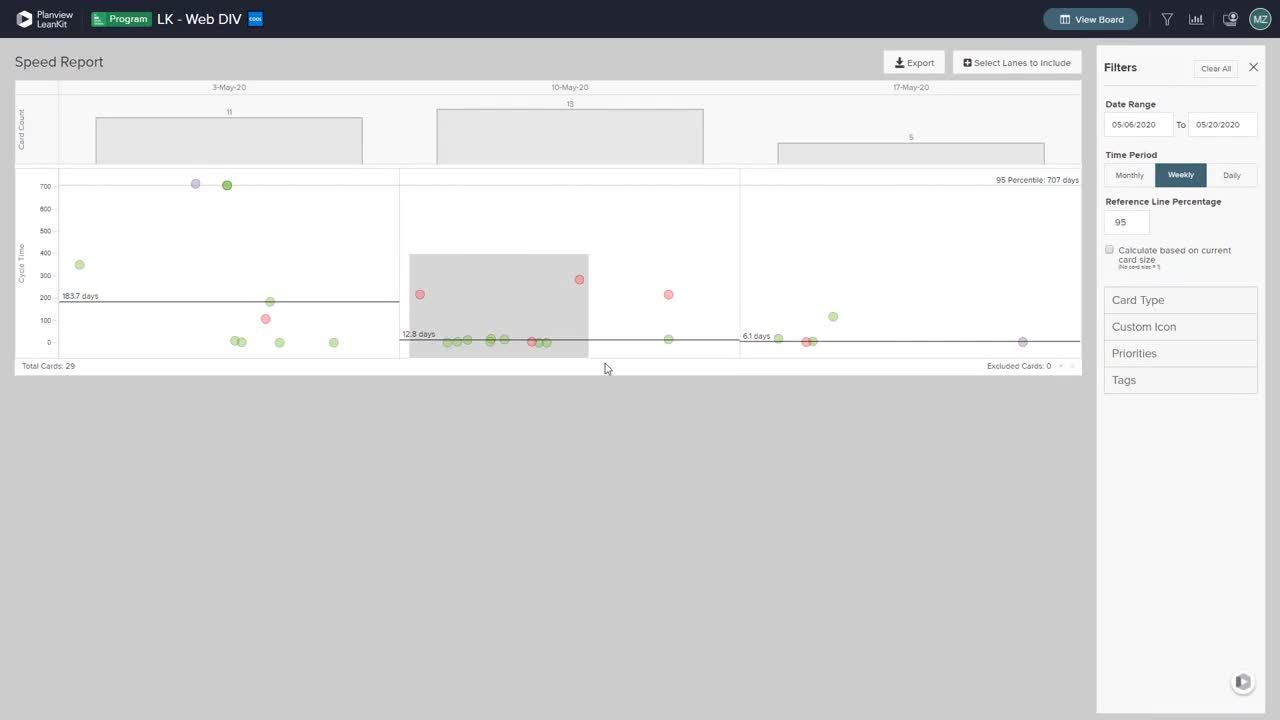
This will display the Speed Report using the default options. The default for the Speed Report displays the average cycle time for all card types across a weekly time period. Hovering over an individual item on the speed report reveals more details.
The Bar Chart
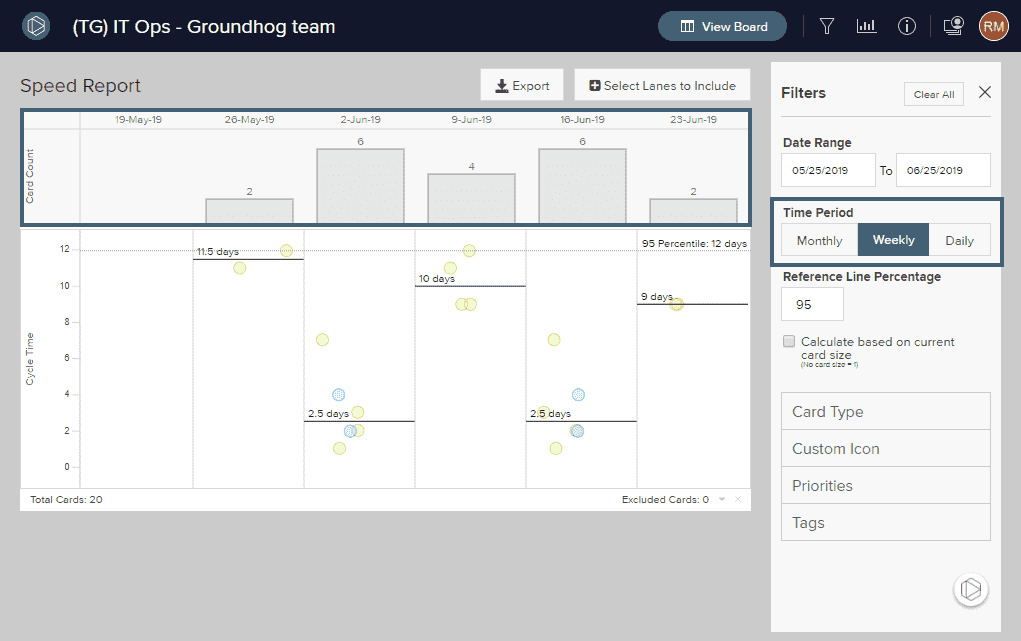
The bar chart at the top of the speed report, above the scatter plot, displays the number of cards completed during various dates. You can filter the dates you would like to view by selecting a time period to the right of the report. You can choose to view Daily, Weekly, or Monthly averages. Selecting a different time period will change how your speed report is displayed.
The Jitter (Scatter) Plot
The dominant visual part of the speed report is a special kind of scatter plot called a jitter plot. The position of cards finishing with the same cycle time value is “jittered,” allowing all cards to be explored, rather than cards with the same cycle time being hidden by one another. Each dot on the jitter plot represents an individual card, and each dot is plotted by the cycle time, or how many days it took to complete the work represented by that card. If read vertically, you can easily determine the approximate number of days the work took to complete. If read horizontally, you can determine on which specific date the work was completed.
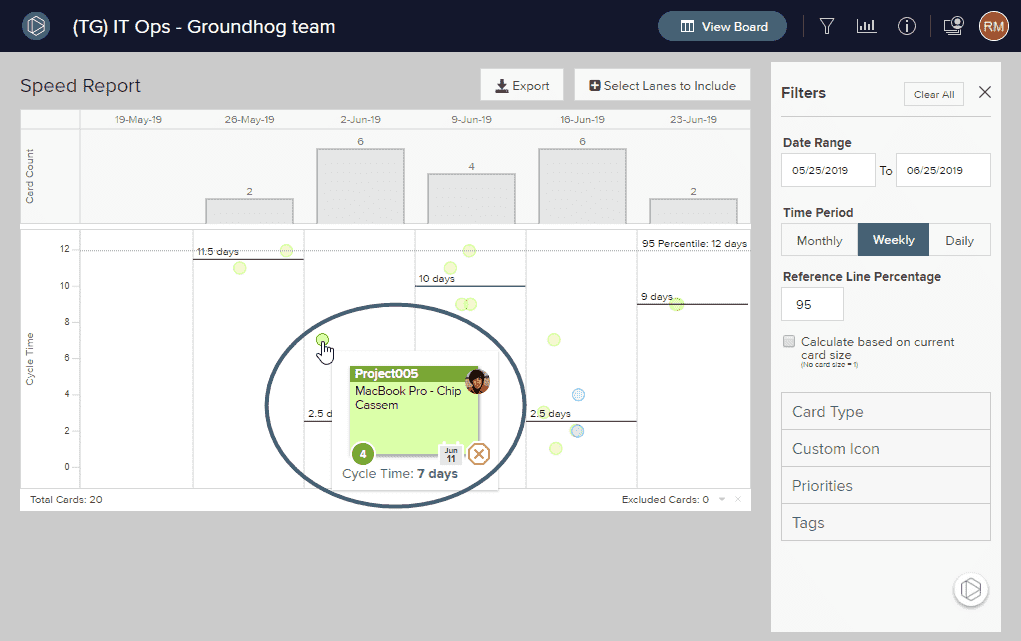
You can hover over any of the dots to display more data on that card. You can also click and drag your mouse over a selection of dots to display more data on those cards below the speed report.
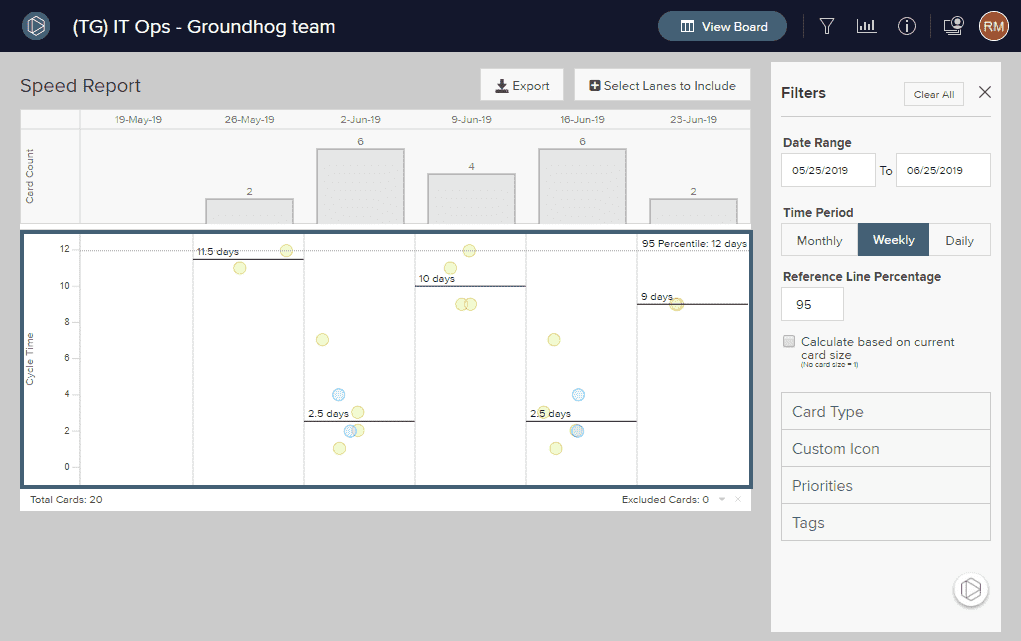
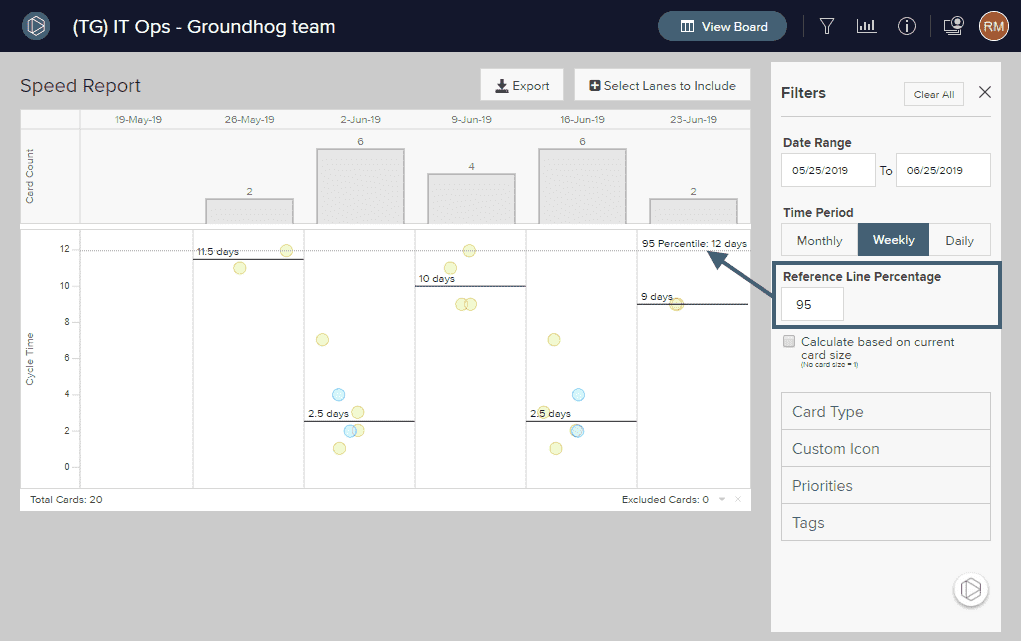
The percentile is used to determine outliers so that you can quickly identify which cards took longer to complete than the majority of the cards. For example, a 95th percentile separates 5% (above the line) of the cards above the 95th percentile (i.e. those cards which took longer than the majority of the other cards cards to complete).
Specify Start and Finish Lanes
You are able to specify start and finish lanes to hone in on more narrowed work processes across a specified time frame. To open up options for start and finish lanes, simply click on the plus sign next to Select Lanes to Include at the top right of the report screen to reveal the board lane selector tool.
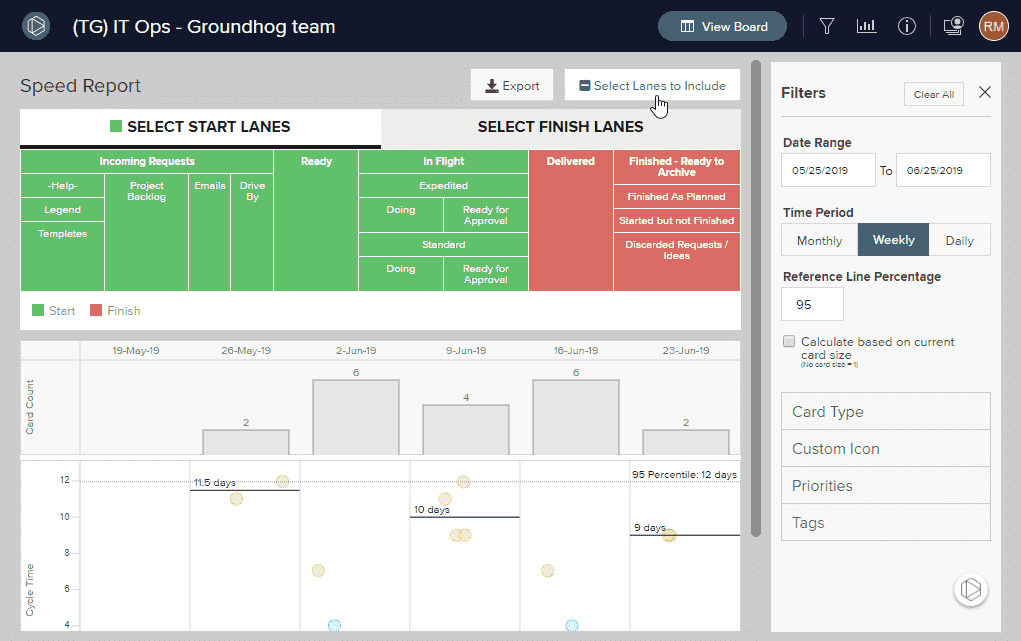
To deselect or select start and finish lanes, click the lane or sub-lane headings. Deselected lanes will appear in gray. Selected start lanes will appear in green. Selected finish lanes will appear in red. Your changes will then be reflected on your Speed Report.
Filter Your Speed Report
To the right of your report, along with the Date Range filter, you’ll find several other ways to narrow the results of your report. You can filter your Speed Report with:
Select a Date Range
Within the Speed Report you are able to filter the report analytics by a specified date range. The date range must be within the previous 365 days. Narrow or lengthen the date range by clicking within either of the Date Range fields to the right of the report to reveal a calendar dropdown and select dates to include.
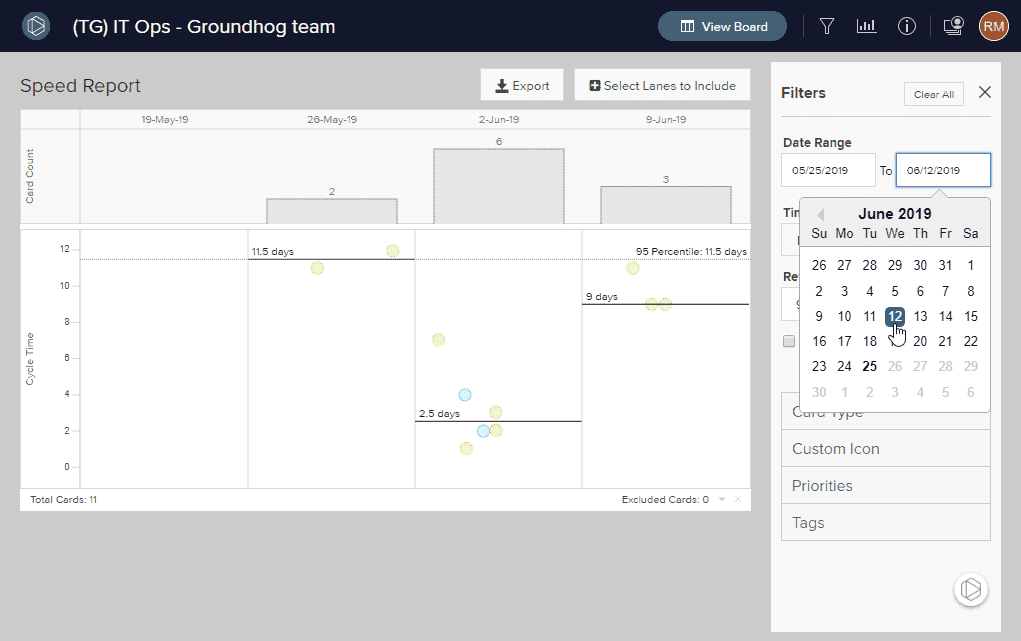
Once you have selected a specific date range, the report will display any work that has been completed -- moved to the red lane(s) on the lane selector -- between those dates, regardless of start date.
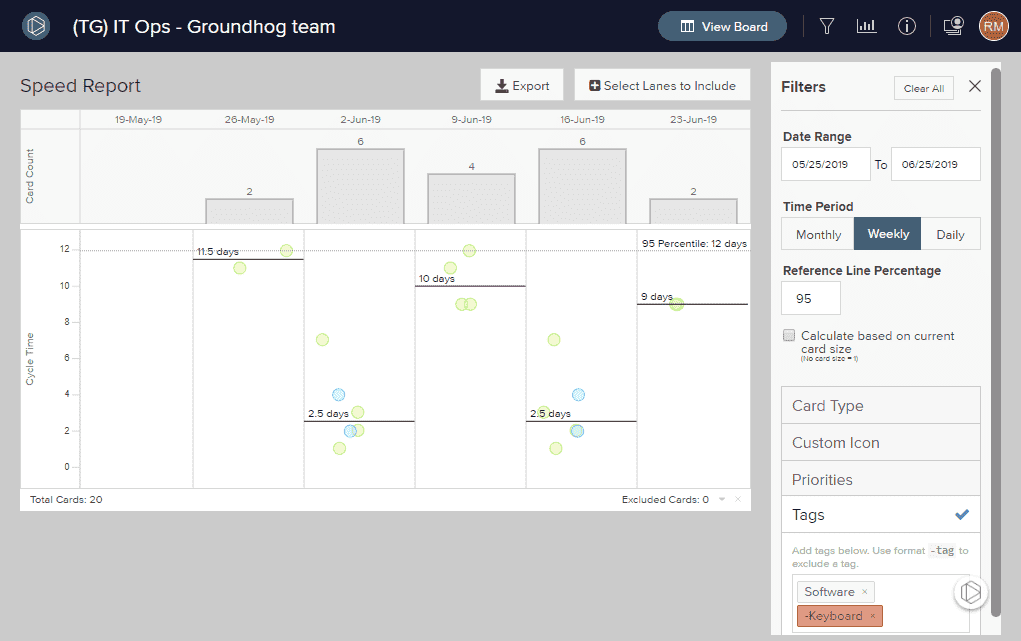
Filter with Tags
You can filter the Speed Report by card tags by entering a comma-separated list of tags as shown below. Use an exclamation point before a tag to specifically exclude cards with that tag.
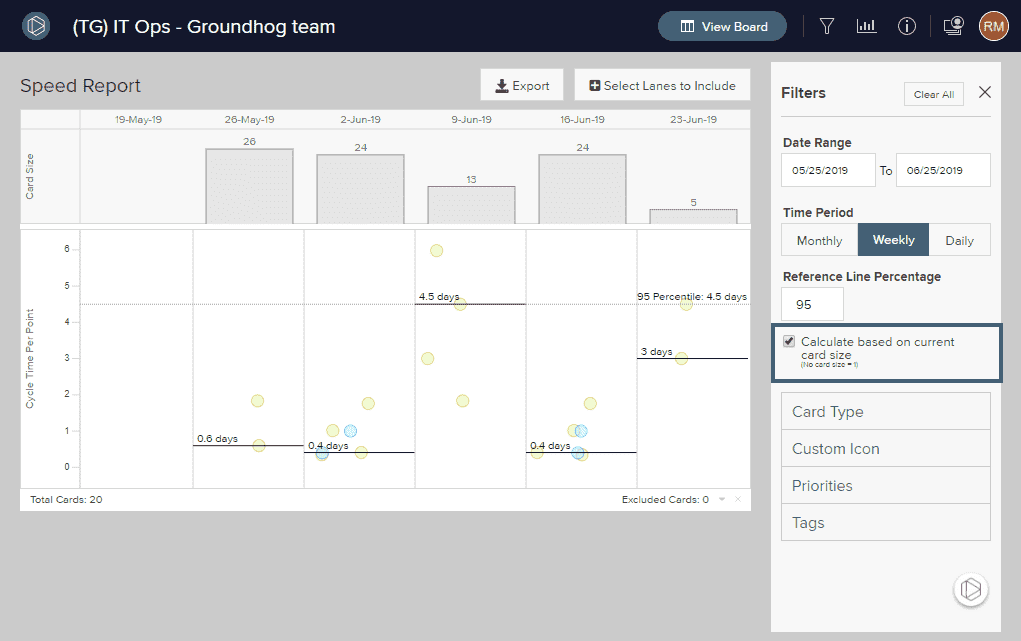
Calculate Based on Card Size
To calculate based on card size, check the box next to Calculate based on Card Size beneath the Tags field.
When Calculate based on Card size is checked, it calculates the cycle time as Total Cycle Time / Card Size.
For example, if a card with a Size of 10 has a cycle time of 10 days, then checking the box will result in a cycle time of 1 because it is a 1 day cycle time for each unit.
Therefore, if one card with a size of 100 takes 200 days to complete and a card with a size of 20 takes 40 days to complete, these have the same relative cycle time in relation to their size, 2 days per unit of measure.
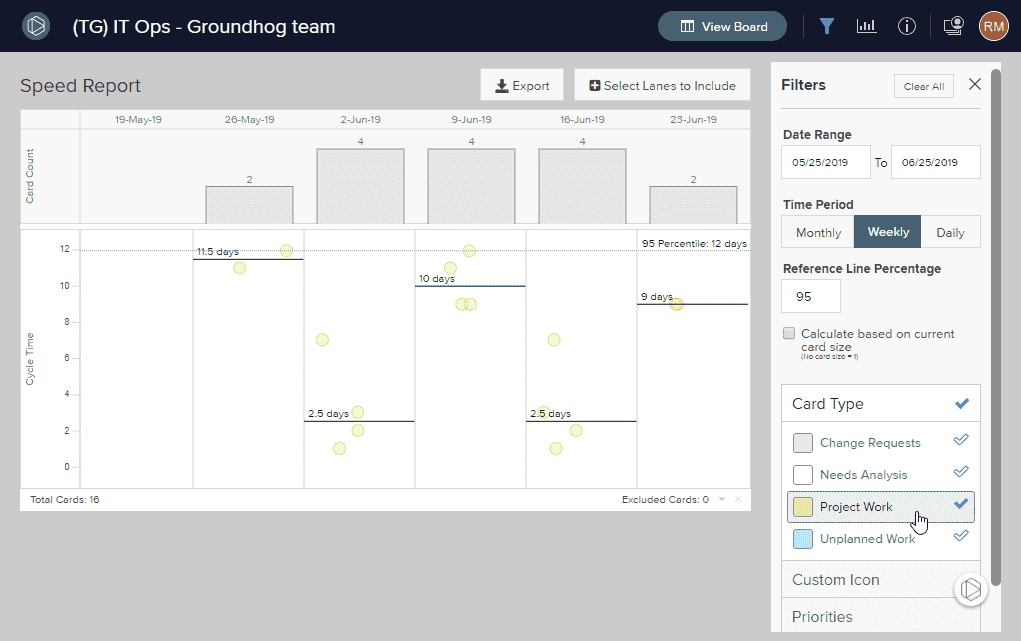
Filter by Card Type
To filter the results of your Speed Report by card type, select which card types you would like to include from the Card Type selector to the right of the report. The card types you select will appear with a green check mark next to them to denote that they have been included in the report.
Filter by Custom Icon
To filter your report by Custom Icon, select one or more icon types from the list under the Custom Icon tab to the right of the report. The icon types you select will appear with a green check mark next to them to denote which custom icons will be included in the report.