Planned Percent Complete (PPC)
Here you'll learn how to:
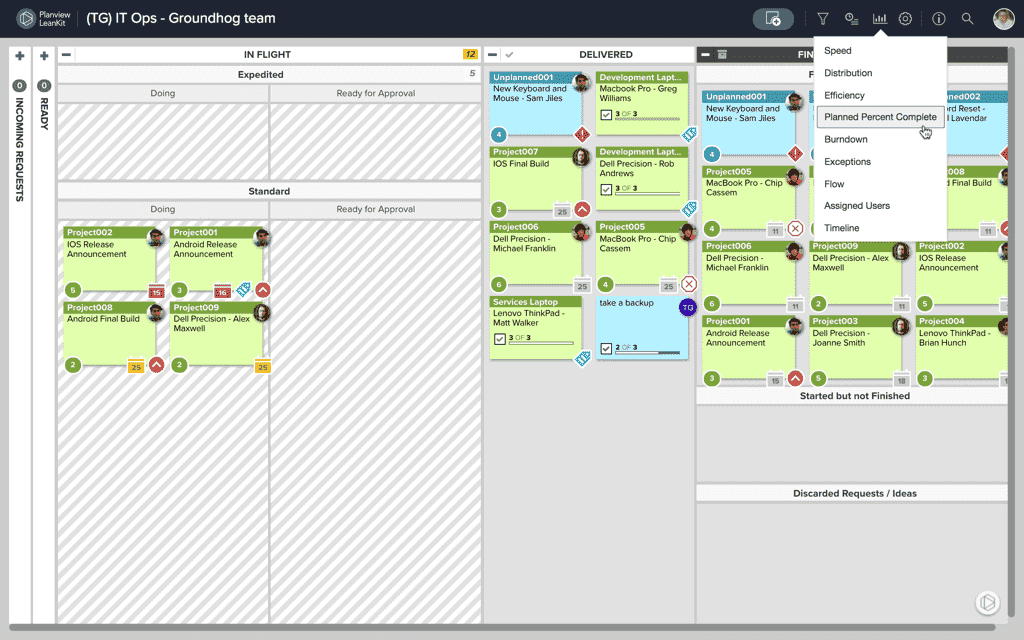
Access the Planned Percent Complete Chart
AgilePlace for Scaled Teams and AgilePlace for Enterprise editions include the Planned Percent Complete (PPC) chart.
Click the charts icon in the upper right of the board and click Planned Percent Complete in the drop-down menu.
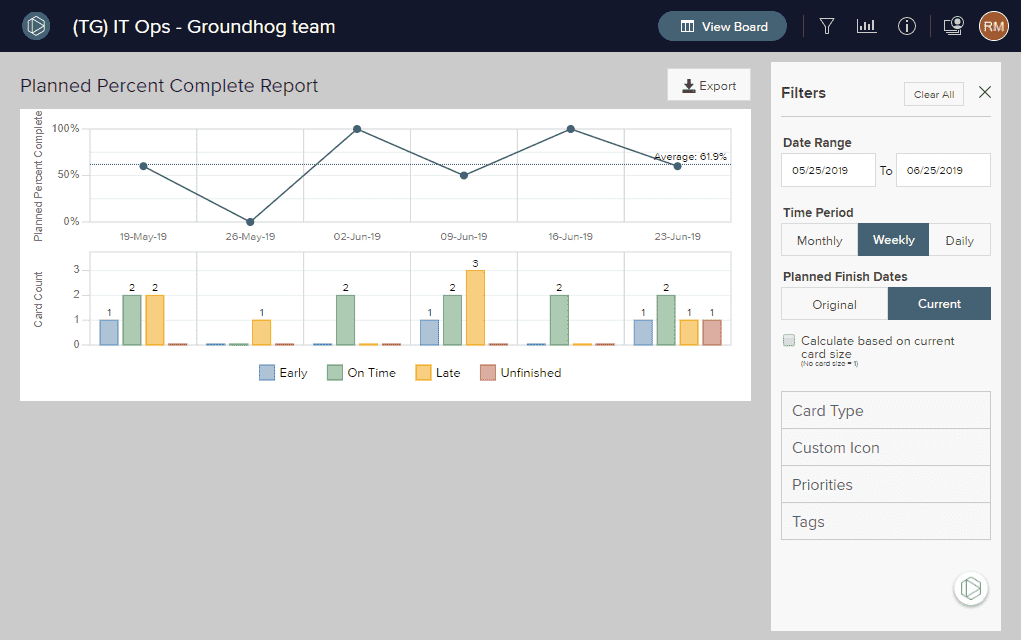
Understand the Planned Percent Complete Chart
The Planned Percent Complete (PPC) chart compares cards' planned finish dates to the actual finish dates to determine whether each item due on a particular date was finished early, on time, or late. You can toggle between Original and Current planned finish dates to get a better understanding of how you are performing against either your original or adjusted plan. There are two main sections to the report: the PPC line chart, and a Card Count bar chart.
Here you'll learn to understand:
NOTE
If the cards on your board do not have planned finish dates, the PPC chart is unlikely to prove useful to you.
Planned Percent Complete
For each day between the start and end dates, this line chart plots the trend of the percentages of cards that are planned to be completed, and either completed early, on time, late, or not yet completed.
This chart answers the question, "For the items with a planned finish date of this date, what percentage were completed by the end of this date?"
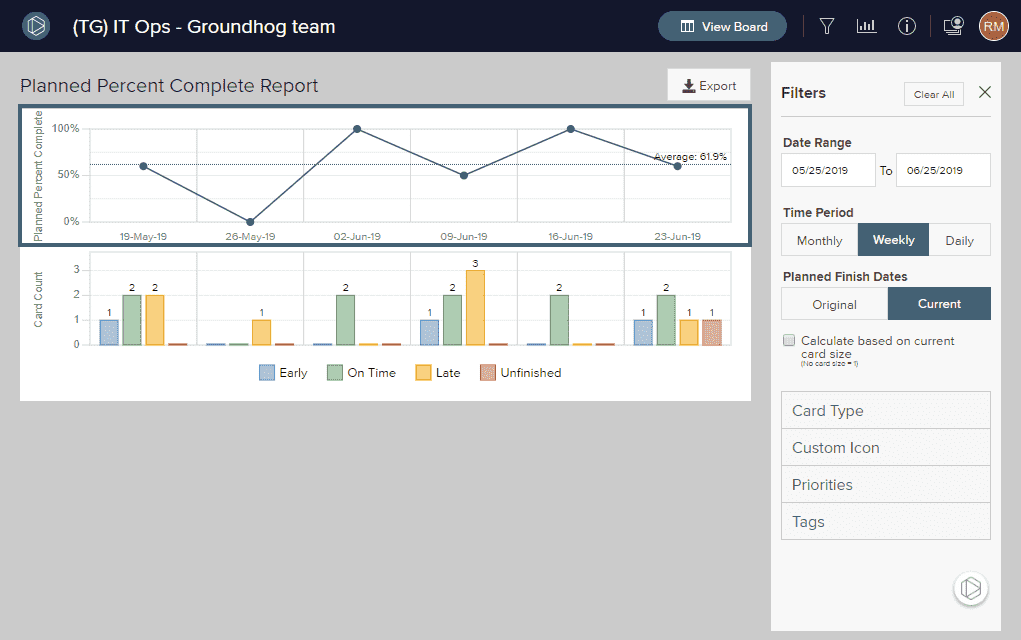
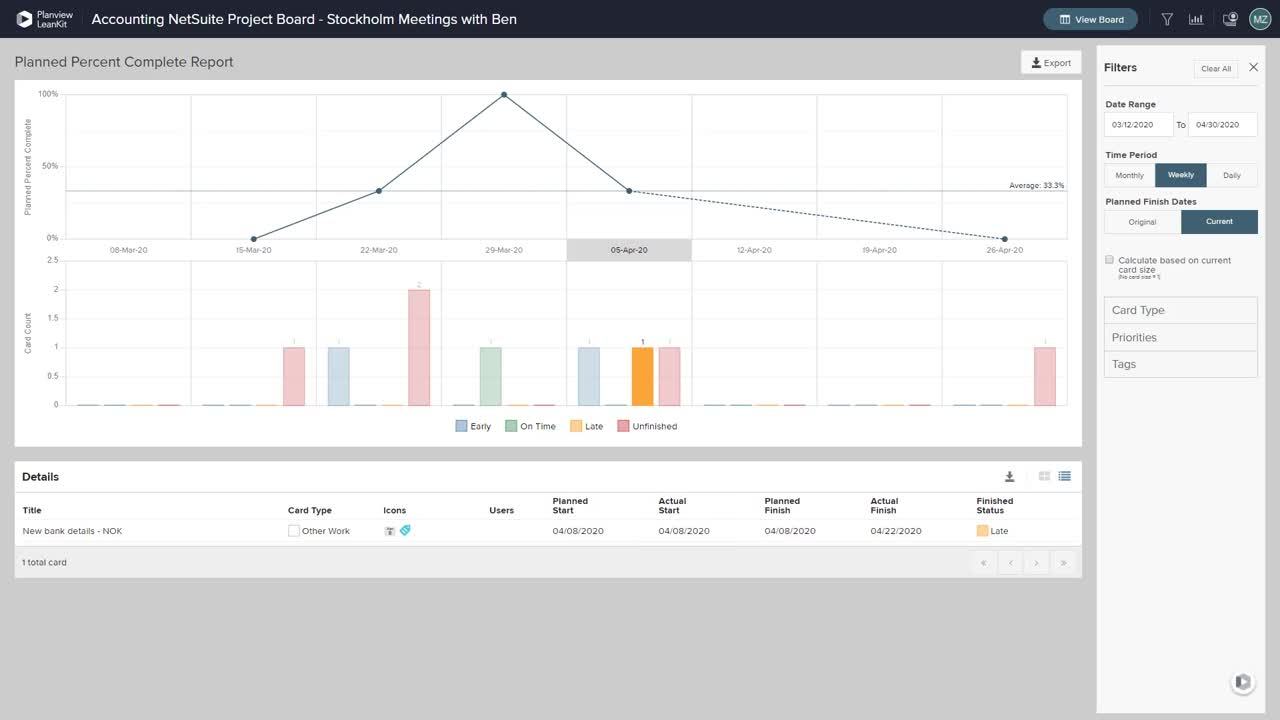
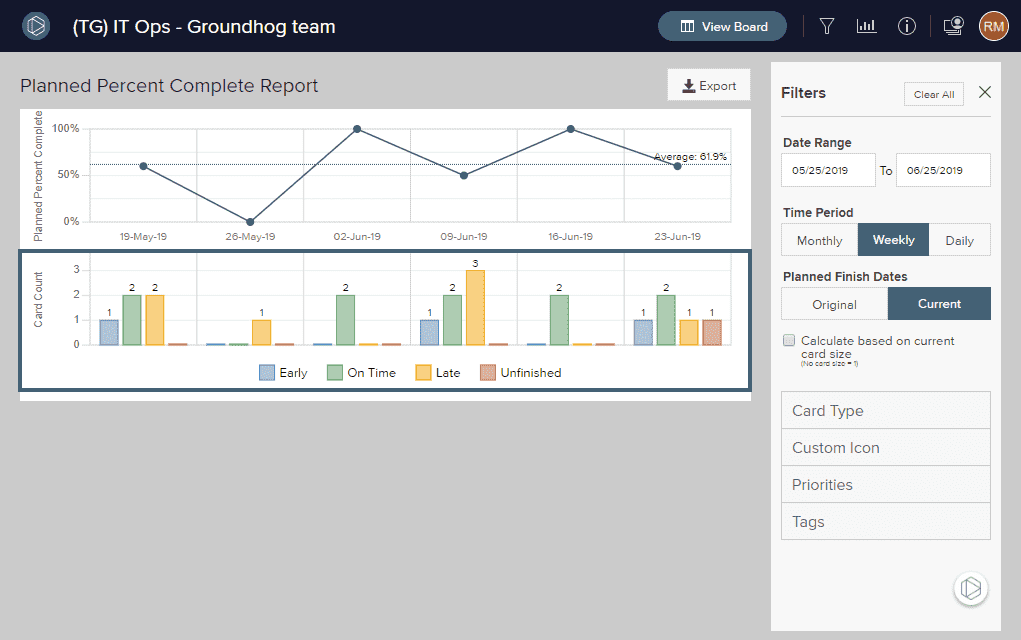
Card Count
In this bar chart, cards are tallied on their planned finish date and according to whether they were completed early, on time, or late.
A card with a planned finish date of June 1 but an actual finish date of May 28 will be counted in the "early" bar for June 1. A card with a planned finish date of June 1, but completed on June 7 will be counted in the "past due" bar for June 1.
The bars are colored indicating the status of the cards counted:
- Blue = Early: delivered prior to planned finish date.
- Green = On Time: completed on the planned finish date, or within two days before the planned finish date.
- Yellow = Late: delivered after the planned finished date
- Red = Unfinished: still not delivered, even though the planned finish date has passed.
Configure the Planned Percent Complete chart
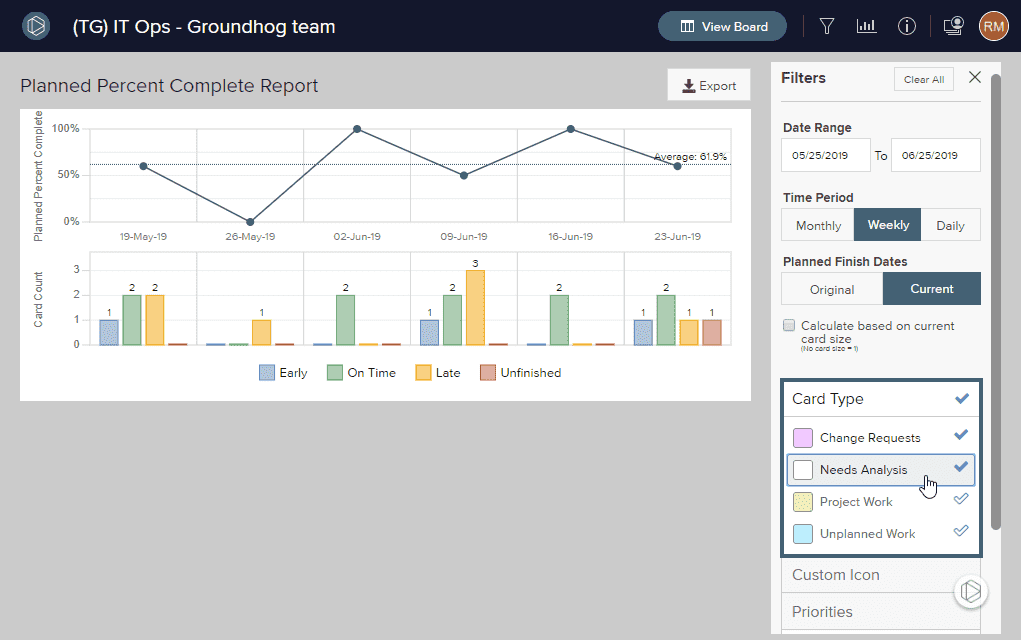
The Planned Percent Complete chart can be filtered by:
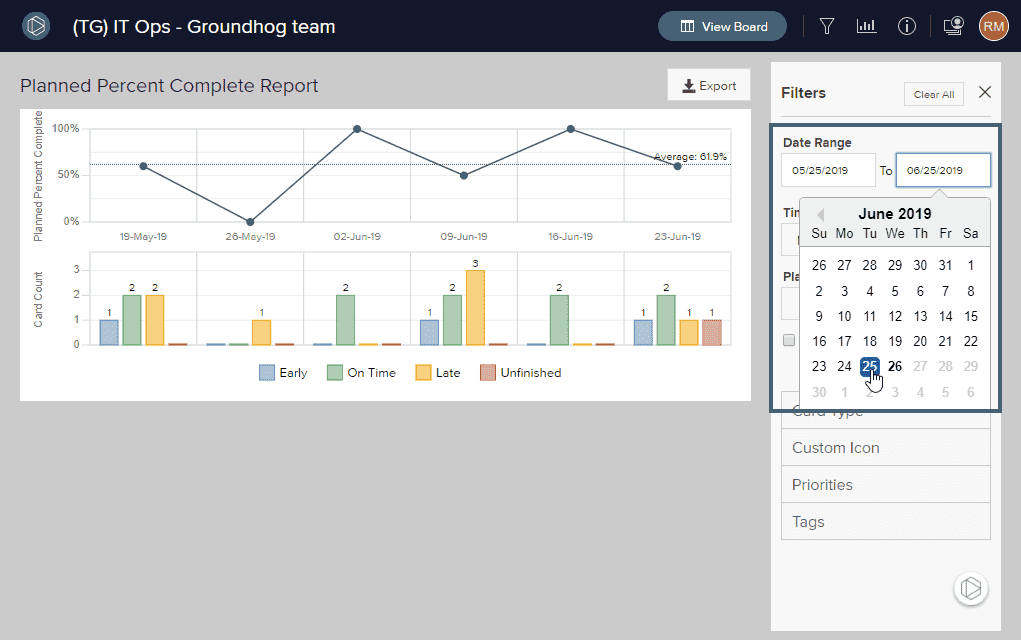
Set the Date Range
- To set the start date, click in the left-most date box. Enter the start date of the iteration in the box, or use the calendar that pops up to click on the desired date.
- To set the stop date, click in the right-most date box. Enter the end date of the iteration in the box, or use the calendar that pops up to click on the desired date.
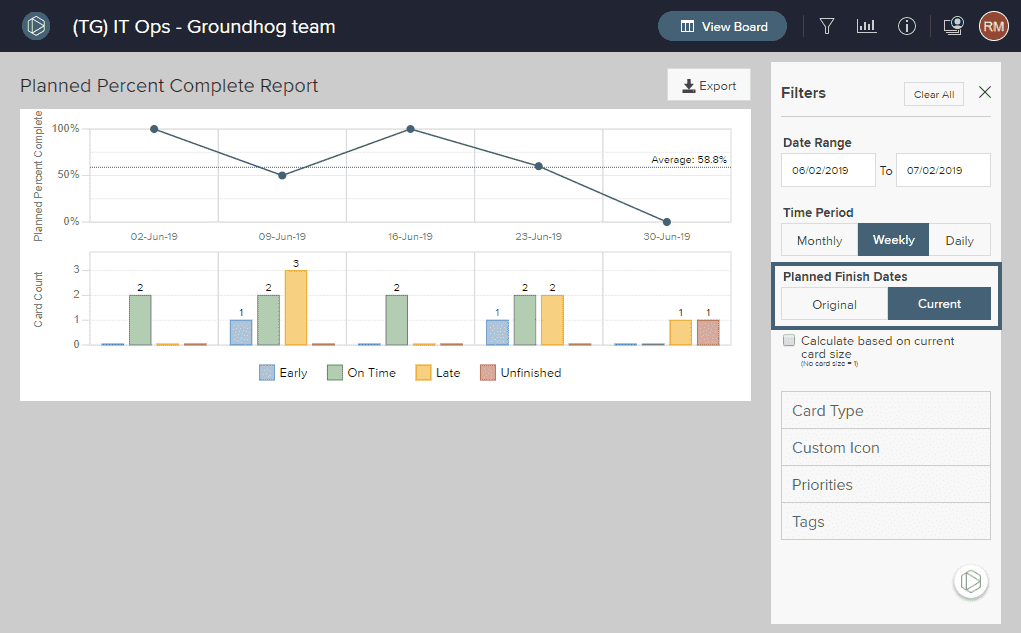
Original vs. Current Planned Finish Date
You can toggle between the Original and Current planned finish date. The Original planned finish date is the planned finish date a card had when it moved from the backlog, or, if the card did not have a planned finish date when it was in the backlog, it is the first planned finish date given. The Current planned finish date is the planned finish date currently shown on the card.
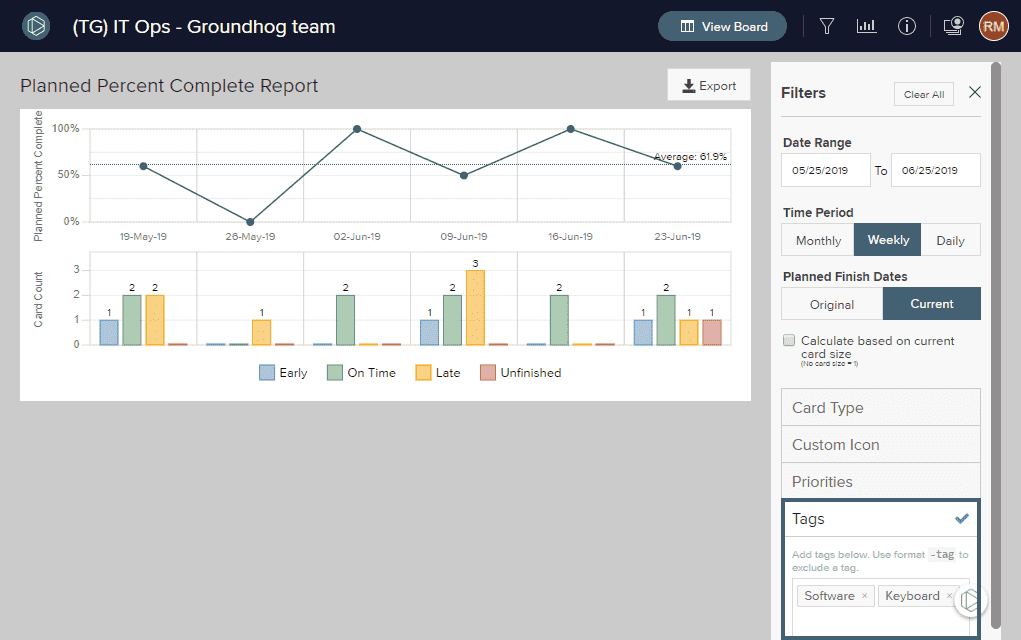
Filter by Card Tags
Enter a comma-separated list of tags in the Tags box to the right of the chart. Use an exclamation point before a tag to specifically exclude cards with that tag.
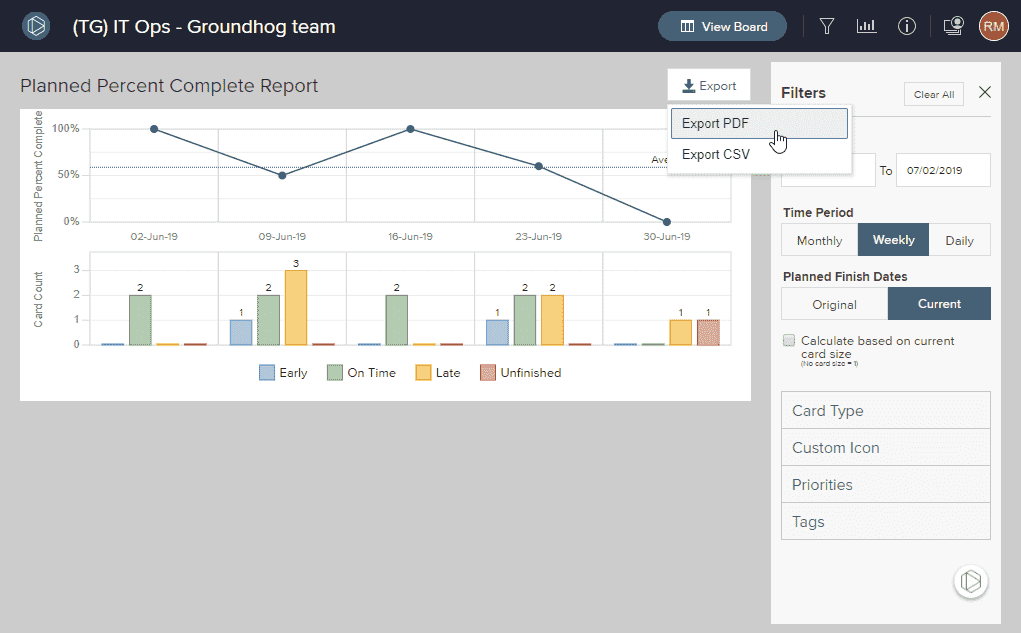
Export the Planned Percent Complete Report
To export the PPC report to PDF or CSV format, click the Export button and select the desired format.