
View Board Health
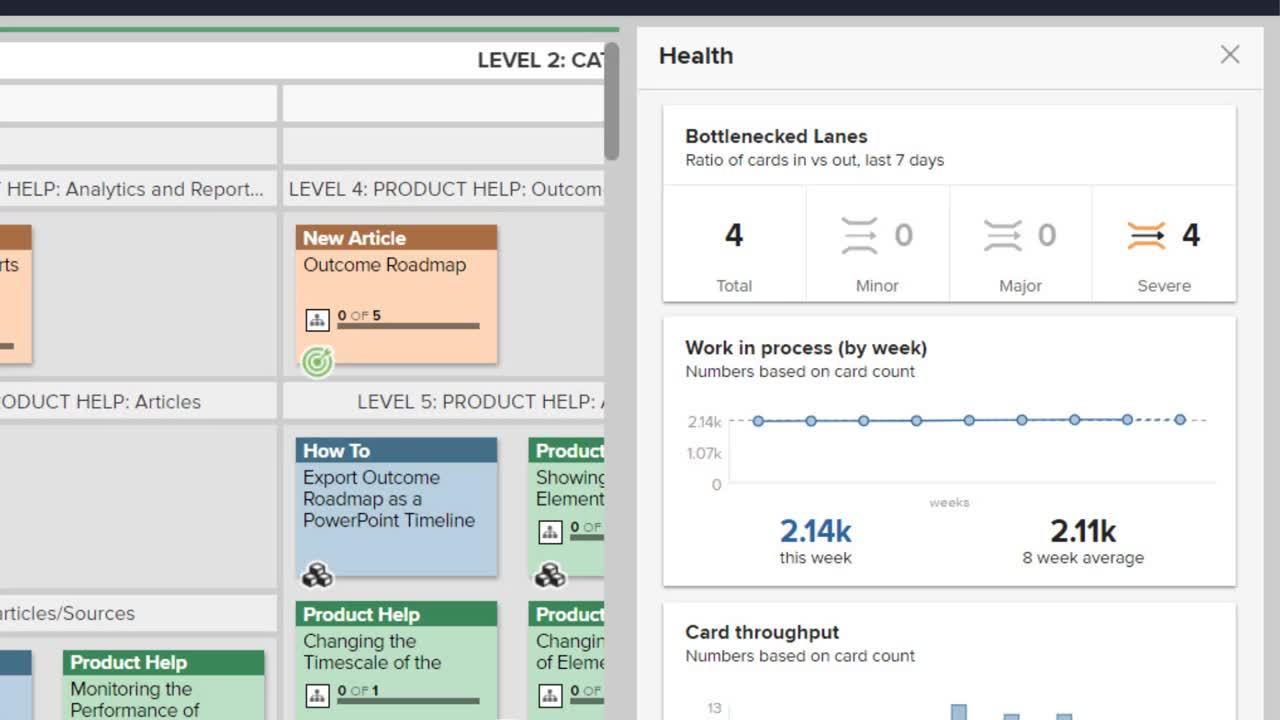
Wondering if things are running smoothly? Just press the H key on your keyboard to open the Board Health panel. The Board Health panel contains three widgets that allow users to easily see whether their teams and processes have been improving or worsening.
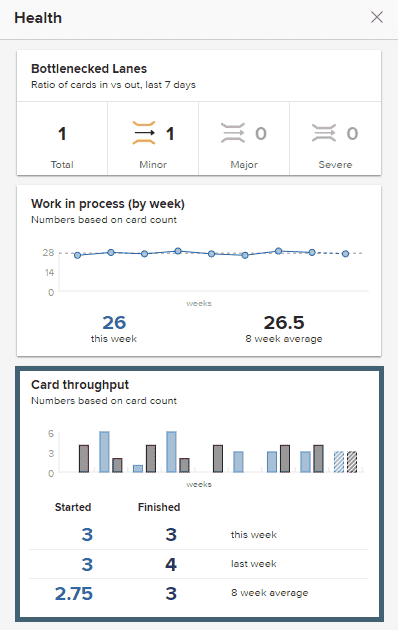
Bottlenecked Lanes
The Bottlenecked Lanes widget helps teams to determine where work is slowing down on their boards. A bottleneck occurs when the rate of work entering a lane exceeds the rate of work exiting that lane over a period of time. The Theory of Constraints argues that actively managing bottlenecks may lead to increased throughput.
The widget displays a count of all bottlenecks that exist on your board (Total) and breaks that count into Minor, Major, and Severe categories.
You can select a category to highlight the corresponding lanes on your board.

Hovering over a category will display the mathematical ratio used to define the severity of those bottlenecks.

NOTE
Bottlenecks are calculated using a rolling time period of the previous 7 days.
Work In Process (WIP)
This widget focuses on the trend of weekly work "in-flight" for the past eight weeks, along with an average for that period. Actively managing and reducing a team's WIP can spark a chain reaction of improvements, such as reduced task switching, improved cycle times, and increased quality.
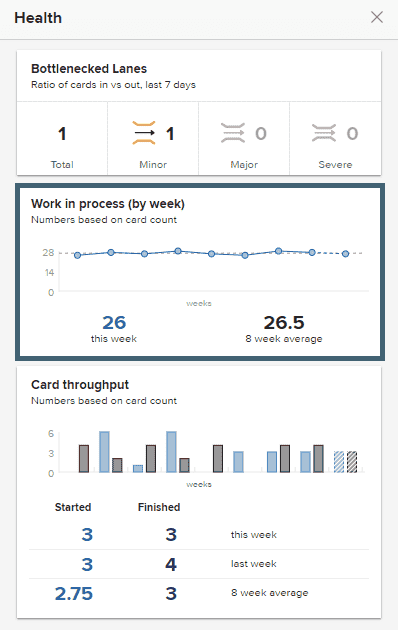
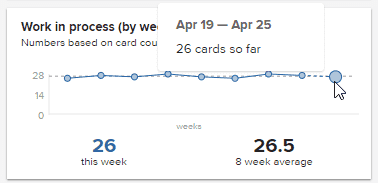
Hovering over a data point will display the card total for a given week.
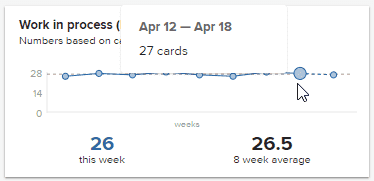
The furthest data point to the right (connected by a dotted blue line) represents the running total for the current week, and will update as the week progresses.
NOTE
By default, weeks within AgilePlace start and end on Sunday. If desired, you can set Monday as the starting day of the week.
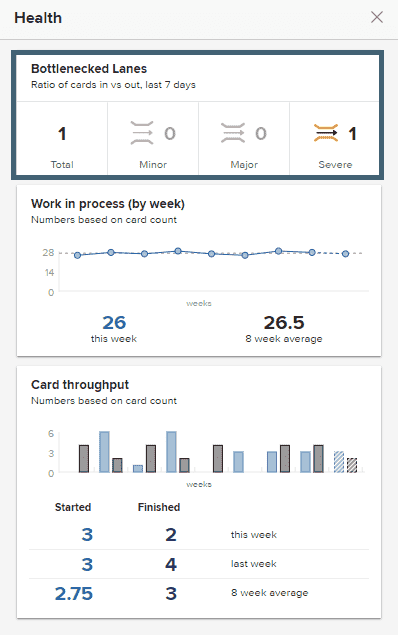
Card Throughput
This widget displays the trend of started (blue) and finished (black) cards in a bar chart. A summary of started and finished cards for this week, last week, and an average of the last eight weeks is displayed below the chart.
Hovering over a bar grouping will display the total number of started and finished cards for a given week.

Like the Work in Process widget, the data charted furthest to the right represents a running total for the current week, and will update as the week progresses.

Ideally, teams should be striving to operate in a pull based system - adding work only when capacity allows. Teams that start more work than they finish are operating in a push based system (i.e., where work is added regardless of capacity) and will eventually run into issues associated with overload.