
Efficiency
If a card is in your board's Doing lane, that doesn't necessarily mean it's being done. The Efficiency Report helps you to determine the amount of your in-process work that is active or inactive over a specific period of time. Using this report can help you understand which lanes or areas of your board may be inefficient. It can also help you to determine where and how to implement lane WIP limits.
Here you'll learn how to:
View the Efficiency Report
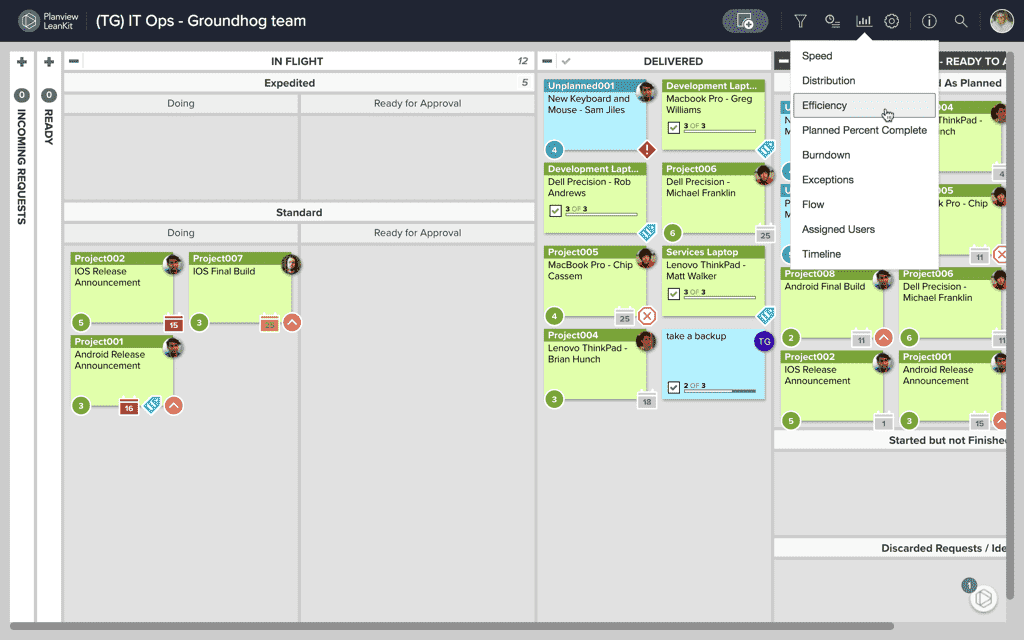
To view a board’s Efficiency Report, click the chart icon toward the upper-right of the board page and select Efficiency from the menu.
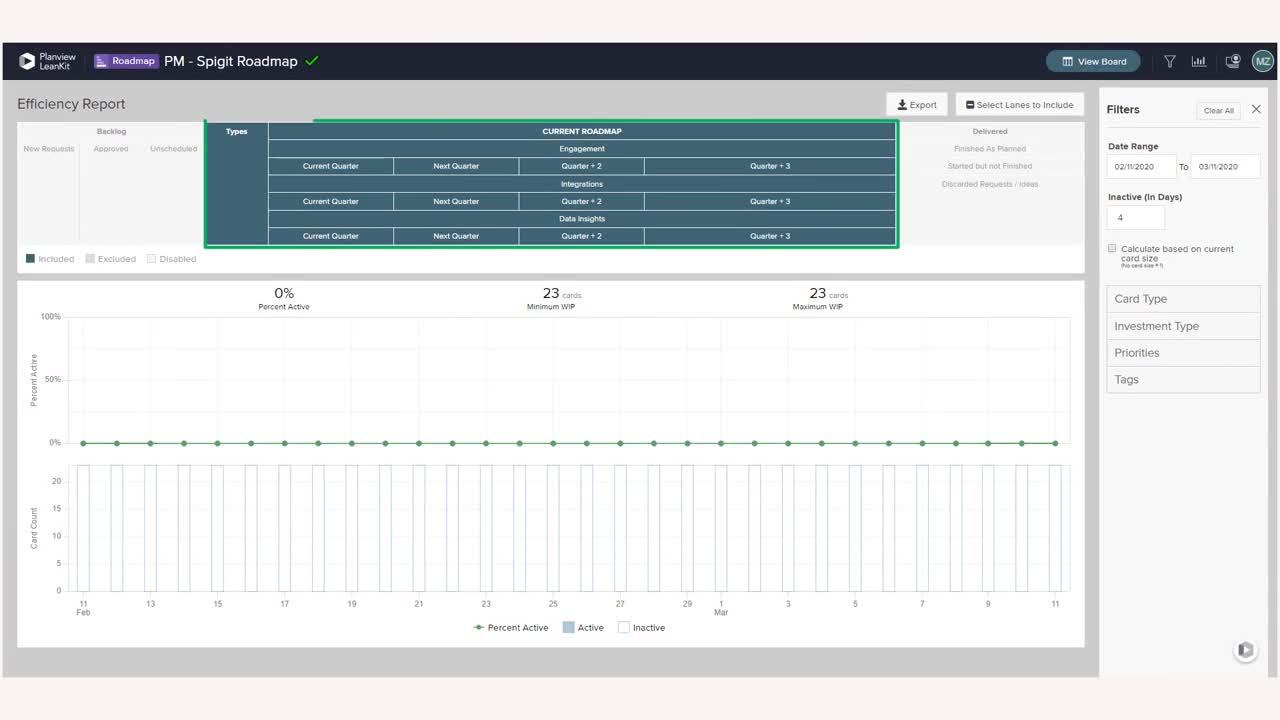
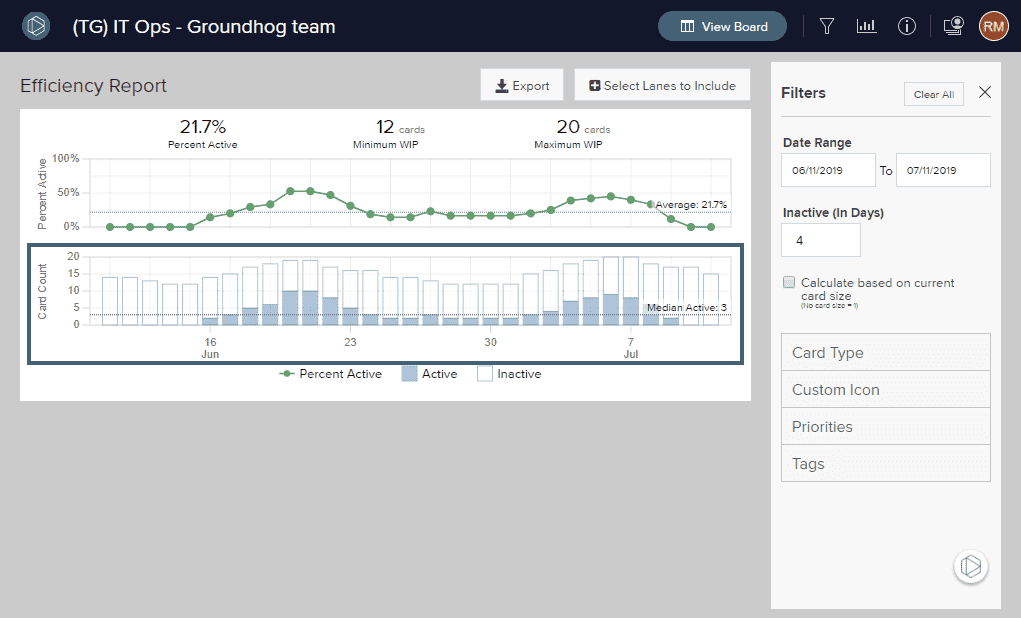
The Efficiency Report will be generated and presented with the default options. Note that the report only displays the In Process lanes by default, and will not allow the selection of any additional lanes. Hovering over a plot point in the diagram displays the percentage of active cards, the number of inactive cards, and the number of active cards for a specific date.
The Key Takeaways at the top of the chart provide the following information:
- Percent Active: The percentage of active cards for the specified date range.
- Minimum WIP: The minimum number of cards in process lanes for the specified date range.
- Maximum WIP: The maximum number of cards in process lanes for the specified date range.
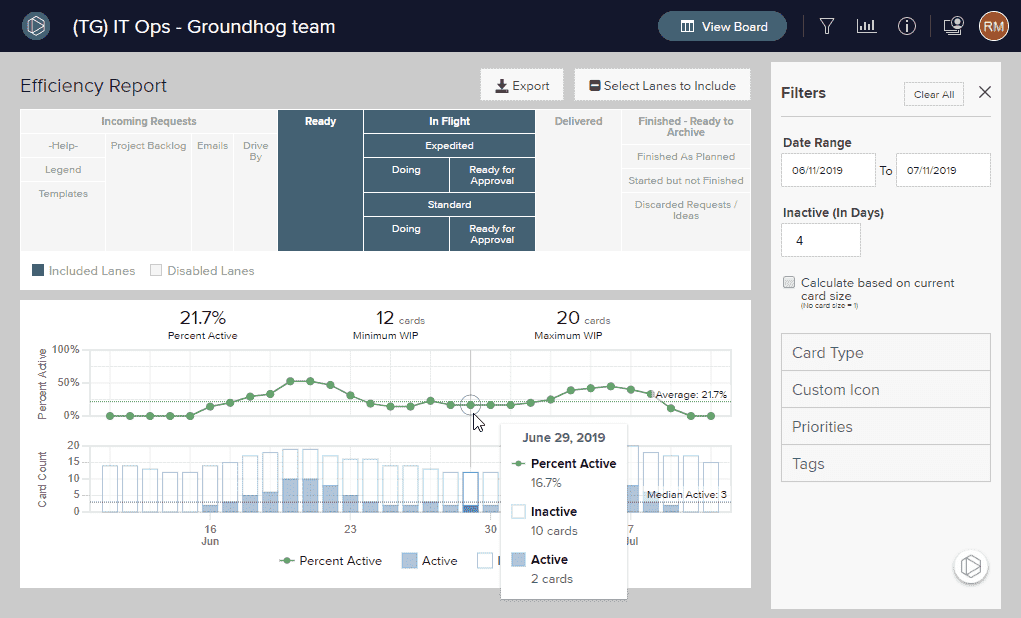
Diagram Views
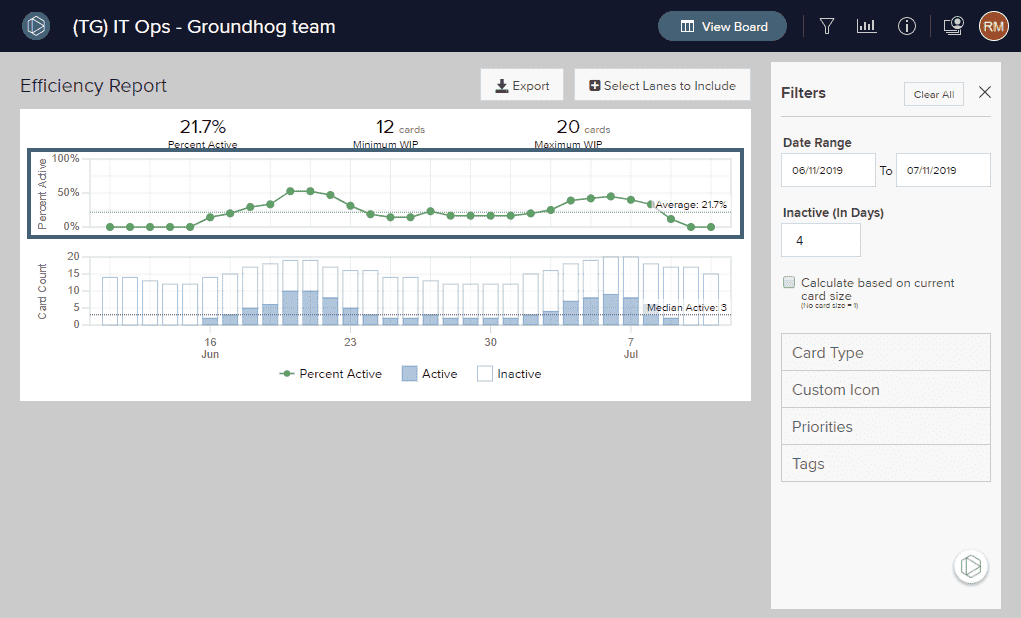
Percent Active
This view plots the percentage of active work items over a specified date range. Hover over a plot point to display more information about the percentage of active cards, the number of inactive cards, and the number of active cards for a specific date.
Filter the Report
The Efficiency Report provides multiple options that can be set that allow you to view the data from different perspectives and with different criteria.
Here you'll learn how to:
- Add and remove lanes
- Select the date range
- Define the Inactive value
- Calculate based on card size
- Filter by card type
- Filter by custom icon
- Filter by tag
Add and Remove Lanes
Click Select Lanes to Include to open a simplified representation of the lane structure on the board.
-
To exclude a lane from the diagram, click on the lane title. Deselected lanes will turn grey and will be excluded from the diagram.
-
To include a lane, click on the lane title of an excluded lane. Included lanes appear as blue.
-
To exclude or include all lanes within a parent lane, click the parent lane's title.
Lanes can be added back by clicking on the lane header again. Any individual lane may be removed, or you can remove all lanes underneath a parent lane by clicking on the parent lane header. Note that the Efficiency report only displays the In Process lanes by default, and will not allow the selection of any additional lanes.
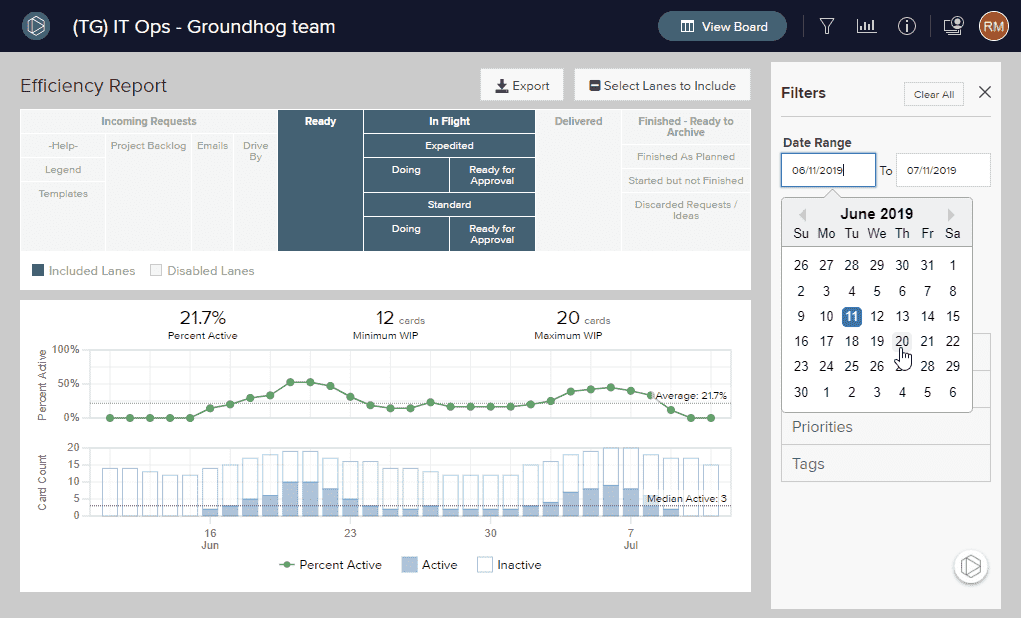
Select the Date Range
You may focus in on a specific date range using the date fields located to the right of the diagram. Click within the fields to reveal a calendar dropdown and choose a date .
Define the Inactive Value
Inactive cards are defined as having no actions (such as edits, comments, or attachments) taken on them for a set period of time. To set a threshold for the period of time to pass before a card is considered inactive, use the Inactive (In Days) field.

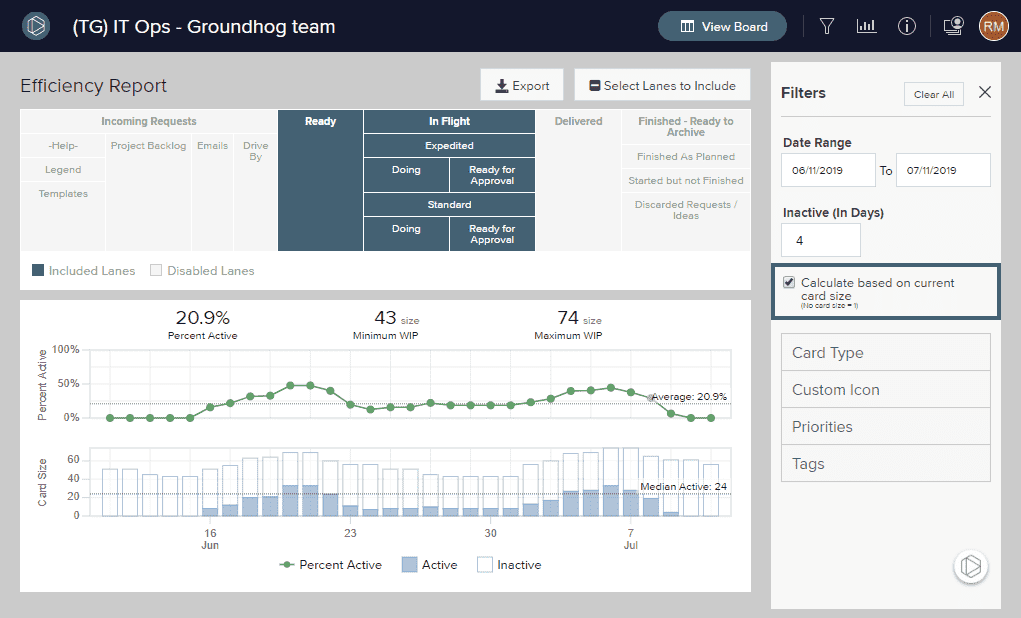
Calculate Work In Progress Based On Card Size
AgilePlace allows you to specify the size value within a card. These size values may represent any metric that your team uses to specify relative size of the work item. These may be hours, days, story points, complexity points, or whatever unit of measurement that your team finds useful. If your team is using the size values to specify the relative size of each card, this metric may be more useful than the number of work items within a lane. For these situations, AgilePlace allows you to generate the Efficiency Report based on the total size of the cards rather than the number of cards in a given lane.
To enable the option, simply check the box beside Calculate based on Card Size . The graph will now calculate the work in progress based on the size specified within the card. Note that any work items that do not have a size specified or have a size of 0 (zero) will be considered with a size of 1 (one) when calculating queue size.
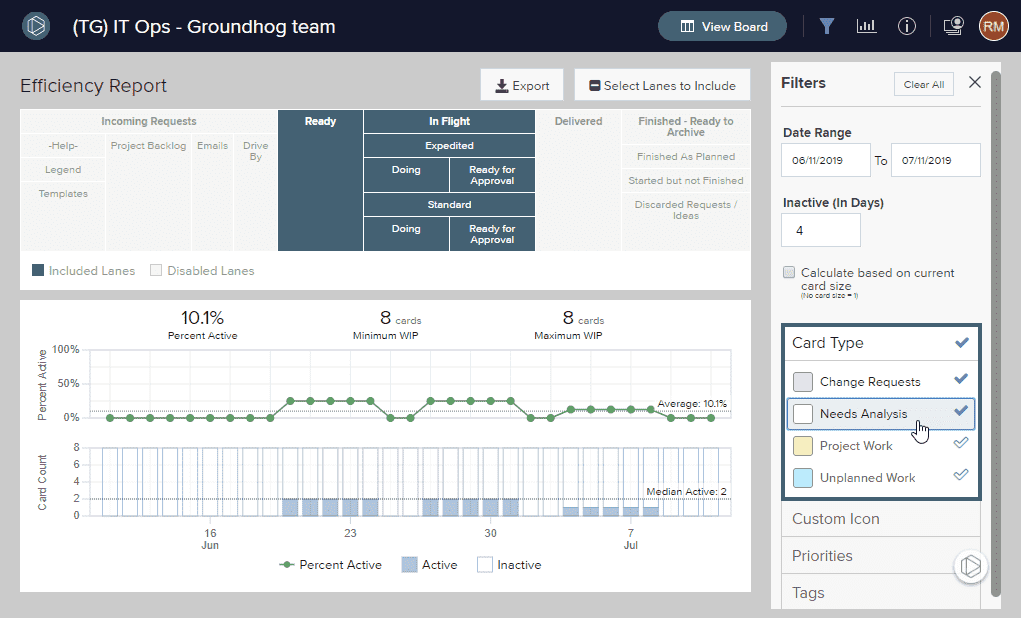
Filter By Card Type
You can filter the Efficiency Report by card type by selecting one or more card types from the Card Types tab.
Filter By Custom Icon
You can filter the Efficiency Report by custom icon by selecting one or more card types from the Custom Icon tab (labeled Class of Service by default).
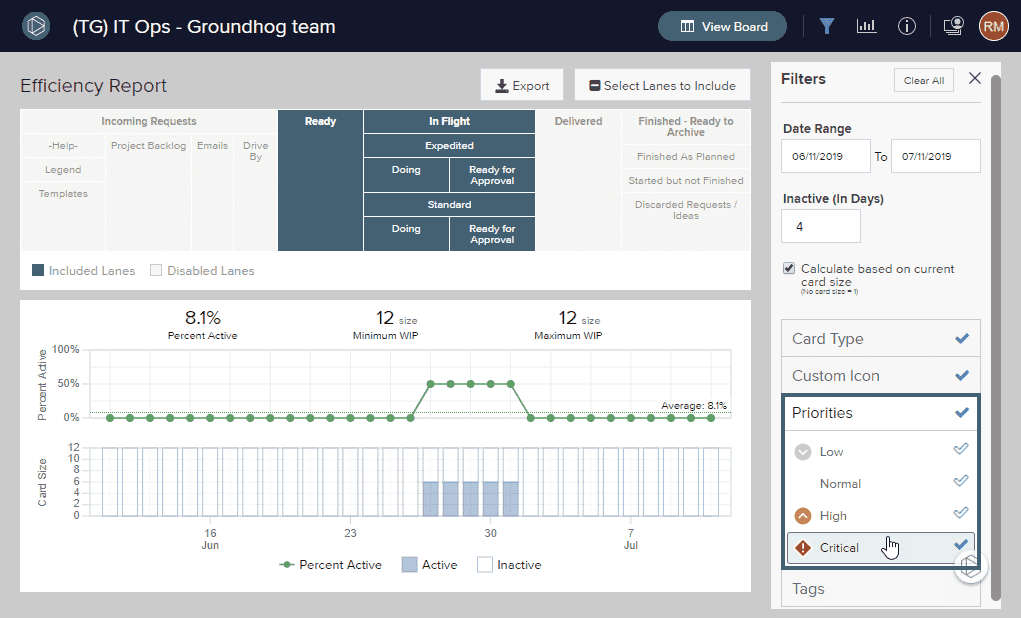
Filter by Priority
To filter the chart by Priority, click Priorities and select the priorities you want to include from the list.
Filter By Card Tag
You can filter the Efficiency Report by card tags by entering tags in the field identified below. Use an exclamation point before a tag to specifically exclude cards with that tag.
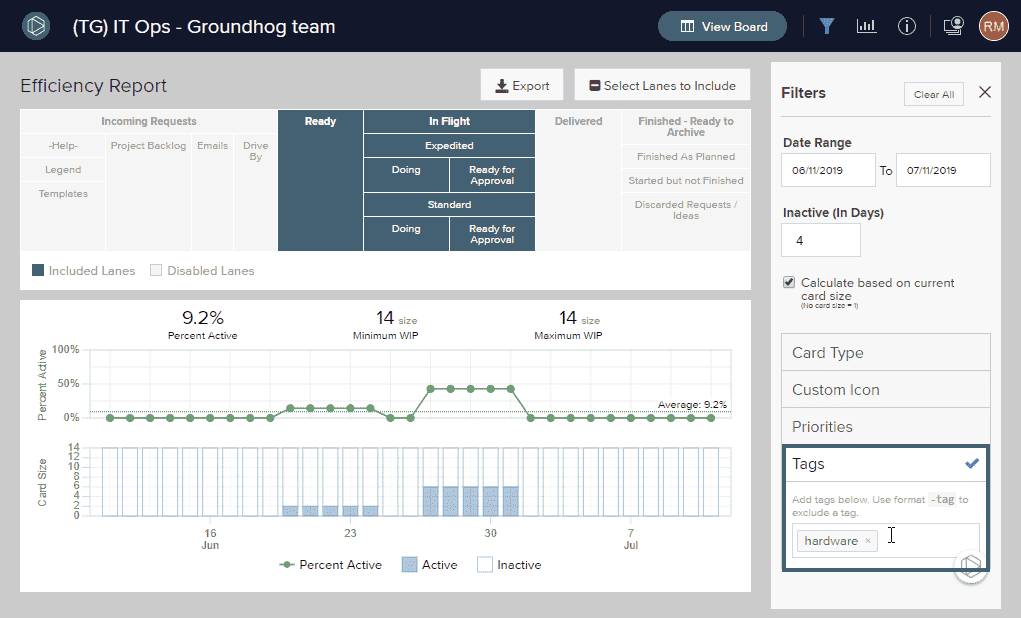
A note about how filtering by tags works: The Efficiency Report will count only cards that have the tags you specified. Using the exclamation point to exclude a tag isn't necessary unless you are expecting the cards to also have one of the tags you have specified for inclusion. In the example above, Cards tagged with "Release 1.2" or "defect" will be included, unless they also are tagged with "architecture."
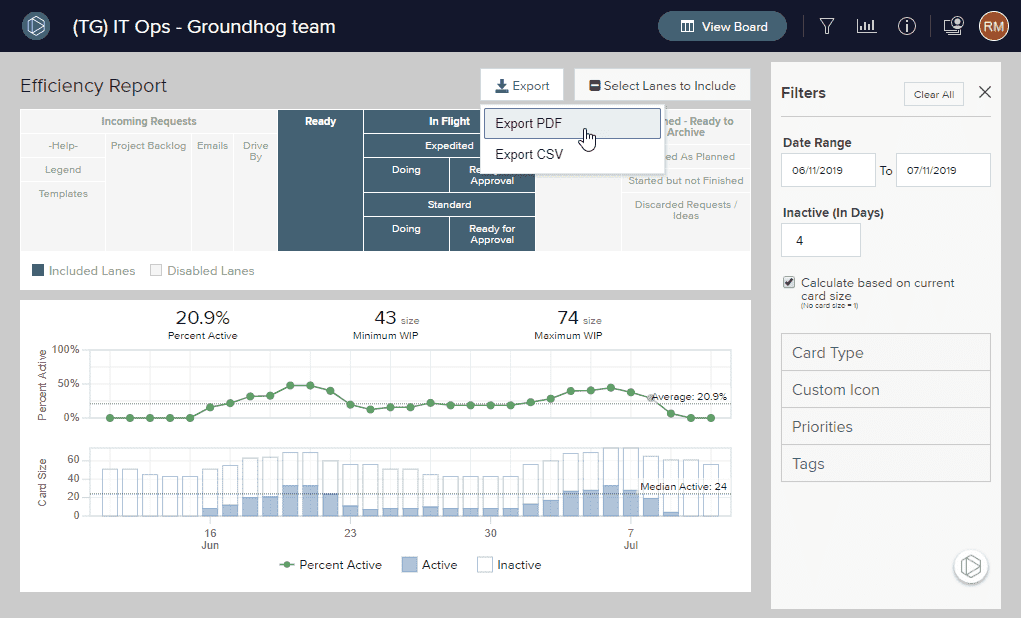
Export the Efficiency Report
To export the Efficiency report to PDF or CSV format, click the Export button and select the desired format.
NOTE
It is not possible to exclude weekend dates from the Efficiency Report. To learn more about why it's not possible to exclude weekend dates please visit the Planview blog covering this topic: Lead Time Metrics: Why Weekends Matter