Distribution Chart
The Distribution chart shows the current distribution of cards within a board by lane, priority, type, or Custom Icon (labelled Class of Service by default). These snapshots provide a quick overview of how work items are distributed within the system and how much of your capacity is dedicated to different types of work
Here you'll learn how to:
- View the distribution chart
- Add and remove lanes
- Calculate based on card size
- Filter the distribution chart
- Export the distribution chart
View the Card Distribution Chart
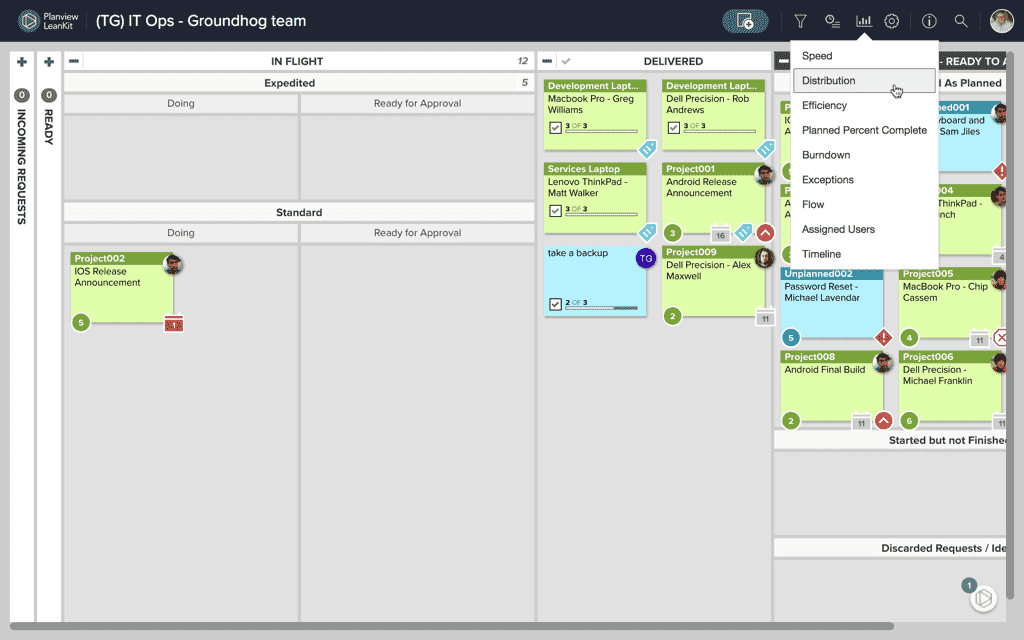
To view a board’s Distribution chart:
- Click the chart icon in the upper-right corner of the board page.
- Choose Distribution.
The default Distribution chart will display the distribution of cards across lanes. The distributions will be calculated based on the number of cards in each lane.
You can:
- Click the arrows to sort the columns in ascending or descending order.
- Click on a user's row to view more details about the cards assigned to them.
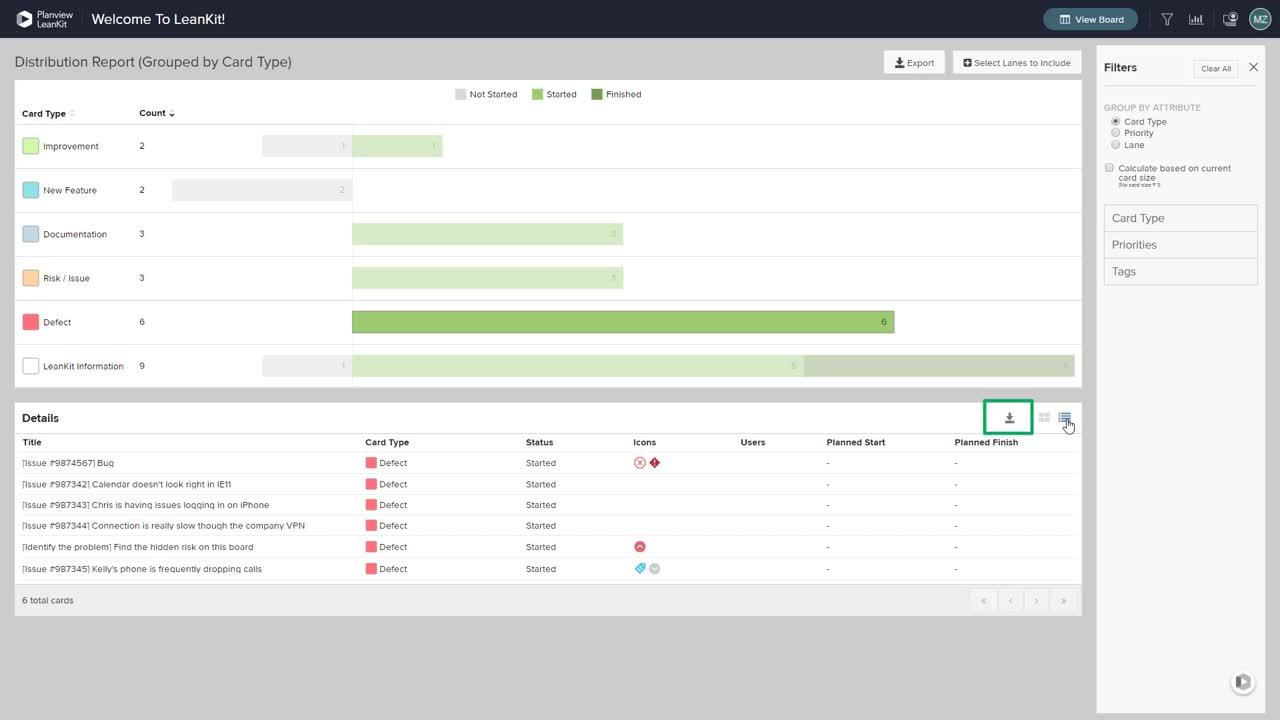
- Switch between a card view and a list view in the Details table.
- Click on a card to view it on its board.
Distribution Chart Views
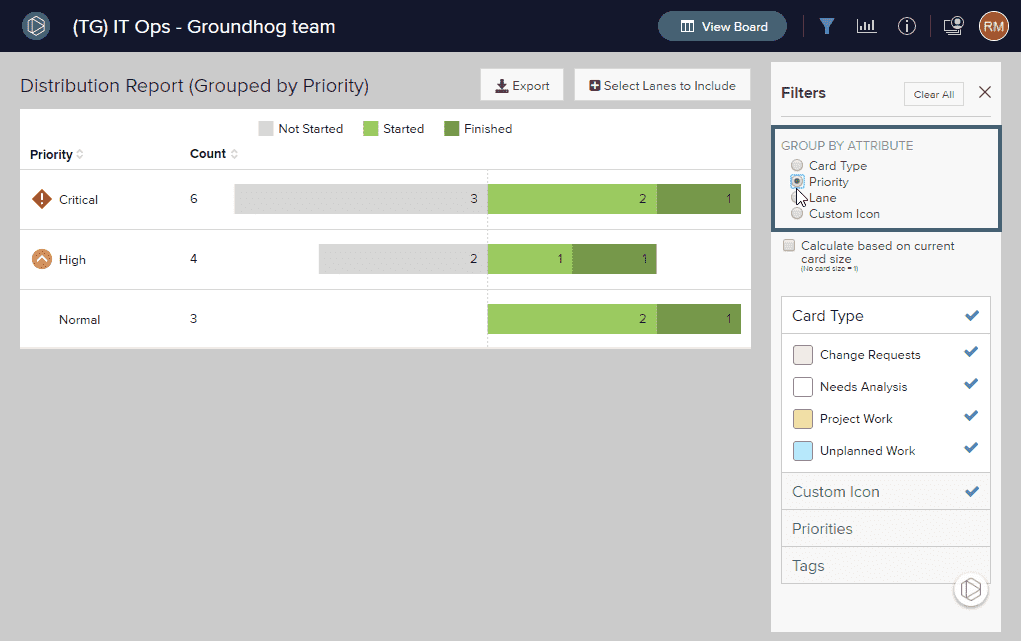
The Distribution chart provides multiple views or perspectives of card distribution across various categories. These different views are available via the checkboxes located to the right of the diagram. These views include:
- Priority: Shows the distributions of cards based on the assigned priority. This view assists you in recognizing issues that may be occurring in relation to prioritization of work.
- Card Type: Shows the distribution of cards based on the assigned Card Type. This view is useful for helping to recognize potential “non-value add” work or quality issues.
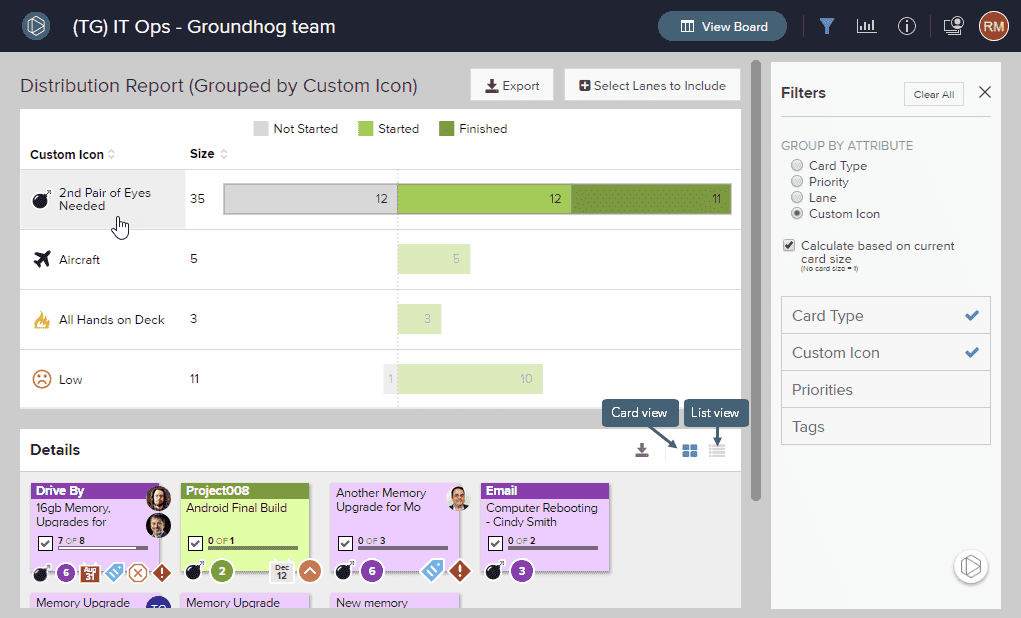
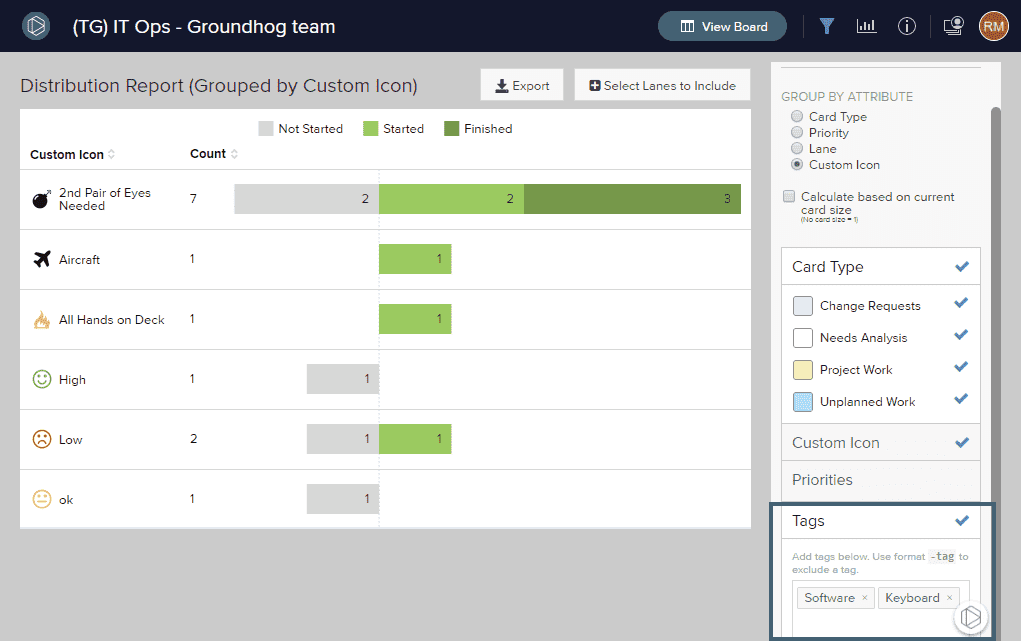
- Custom Icon (labeled Class of Service by default): Show the distribution of cards across the Classes of Service/Custom Icon field when Custom Icon is enabled. For more on enabling Custom Icons, click here.
- Lane: Shows the distribution of cards across the selected lanes. Similar to viewing the Cumulative Flow diagram for the current date.
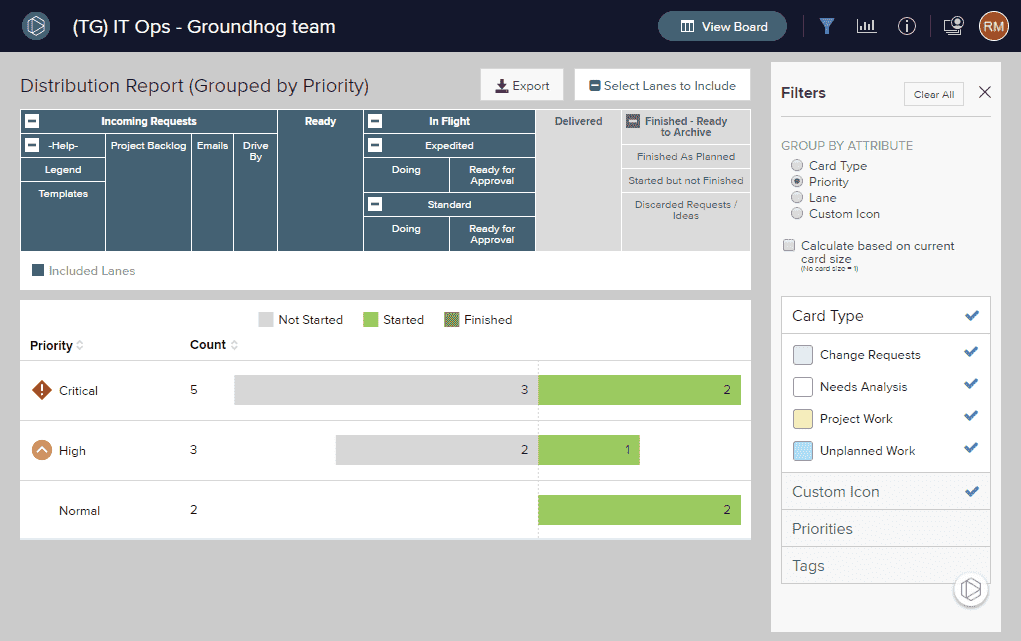
Add and Remove Lanes
You may wish to view the chart without all the lanes included in the dataset. At the top of the page, you'll see Select Lanes to Include. Click Select Lanes to Include to open the board lane selector.
You can remove lanes from the chart by clicking on the lane headers in the board lane selector. Deselected lanes will turn grey, and be excluded from the dataset. Lanes can be added back by clicking on the lane header again.
Aggregating Lanes
You may also want to view the distribution at a less granular level. For this, the ability to aggregate lanes to the their parent lane is provided.
To do this, click on the small icon located in the parent lane header. This will aggregate the total work in progress calculations for the child lanes into the selected parent lane.
To expand the child lanes, click the plus sign icon again. You may roll up any of the child lanes into their parent lane at any level of the hierarchy.
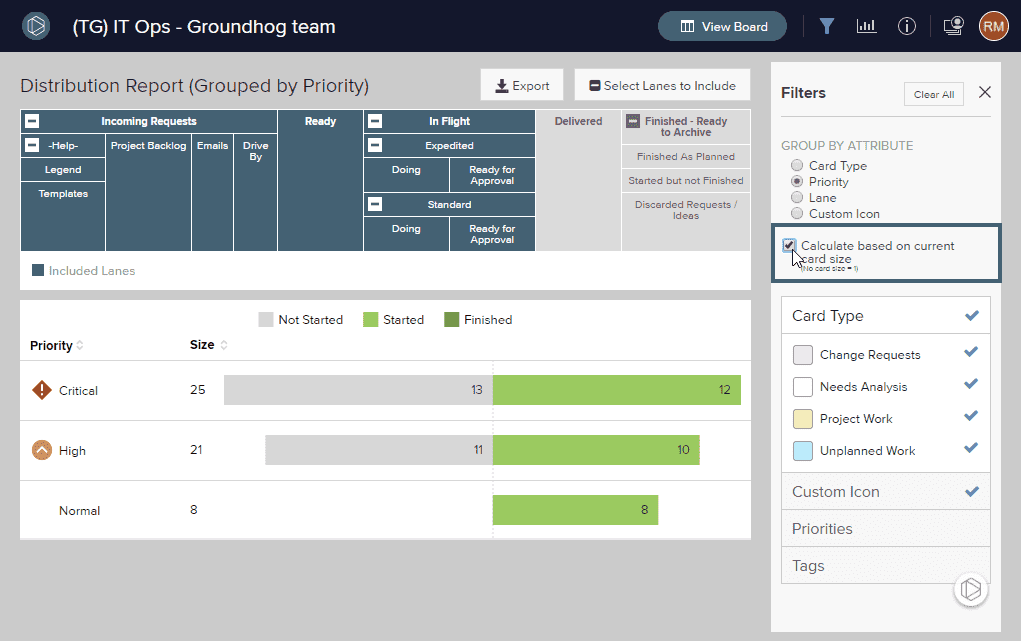
Calculate Based On Card Size
To filter the chart based on card size, simply check the box next to Calculate based on Card Size. The graph will now calculate the work based on the size specified within the card.
Filter by Tags
You can filter the Distribution chart by card tags by entering one or more tags in the Tags field, as shown below, and press enter. Use an exclamation point before a tag to specifically exclude cards with that tag.
Filter by Card Type
You can filter the Distribution chart by card type by selecting one or more card types from the Card Types tab.
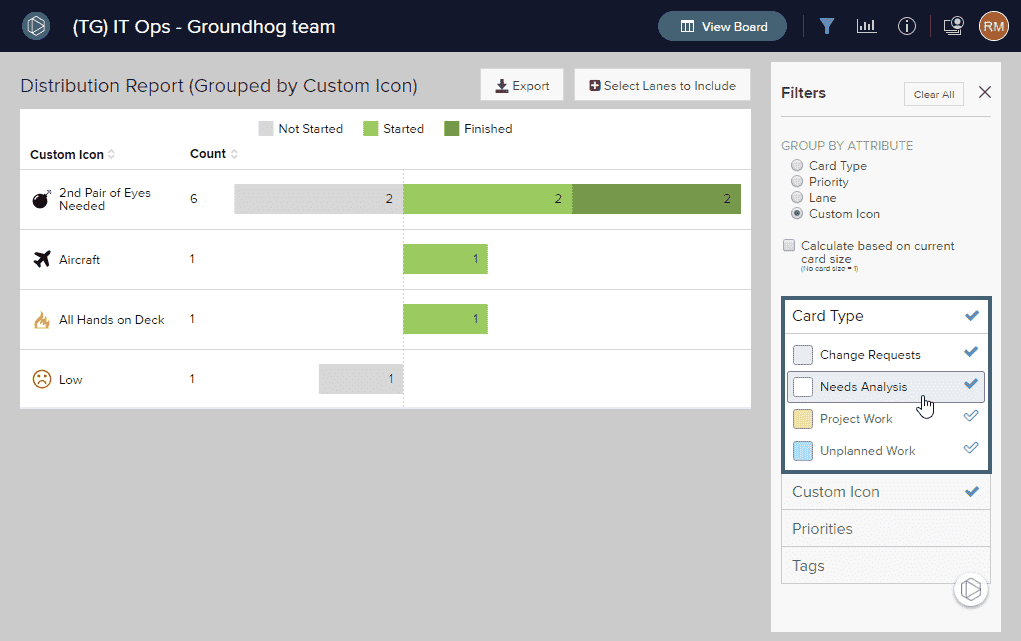
Filter by Custom Icon
You can filter the Distribution chart by custom icon by selecting one or more custom icons from the Custom Icons tab (labeled Class of Service by default).
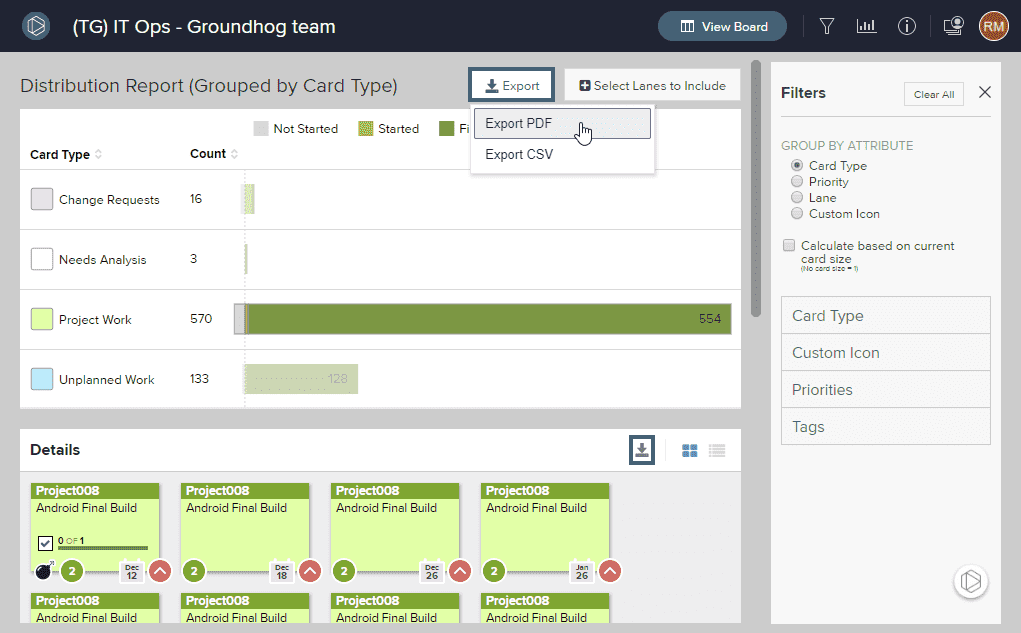
Export the Distribution Chart
To export the Distribution chart to PDF or CSV format, click the Export button and select the desired format. Note that you can export only the data in the lower table, or export all data using the Export button at the top of the report.