Cumulative Time-Series Line Charts
What's New
You can now include cumulative ("s-curve") data in line and simple bar charts.
Benefits
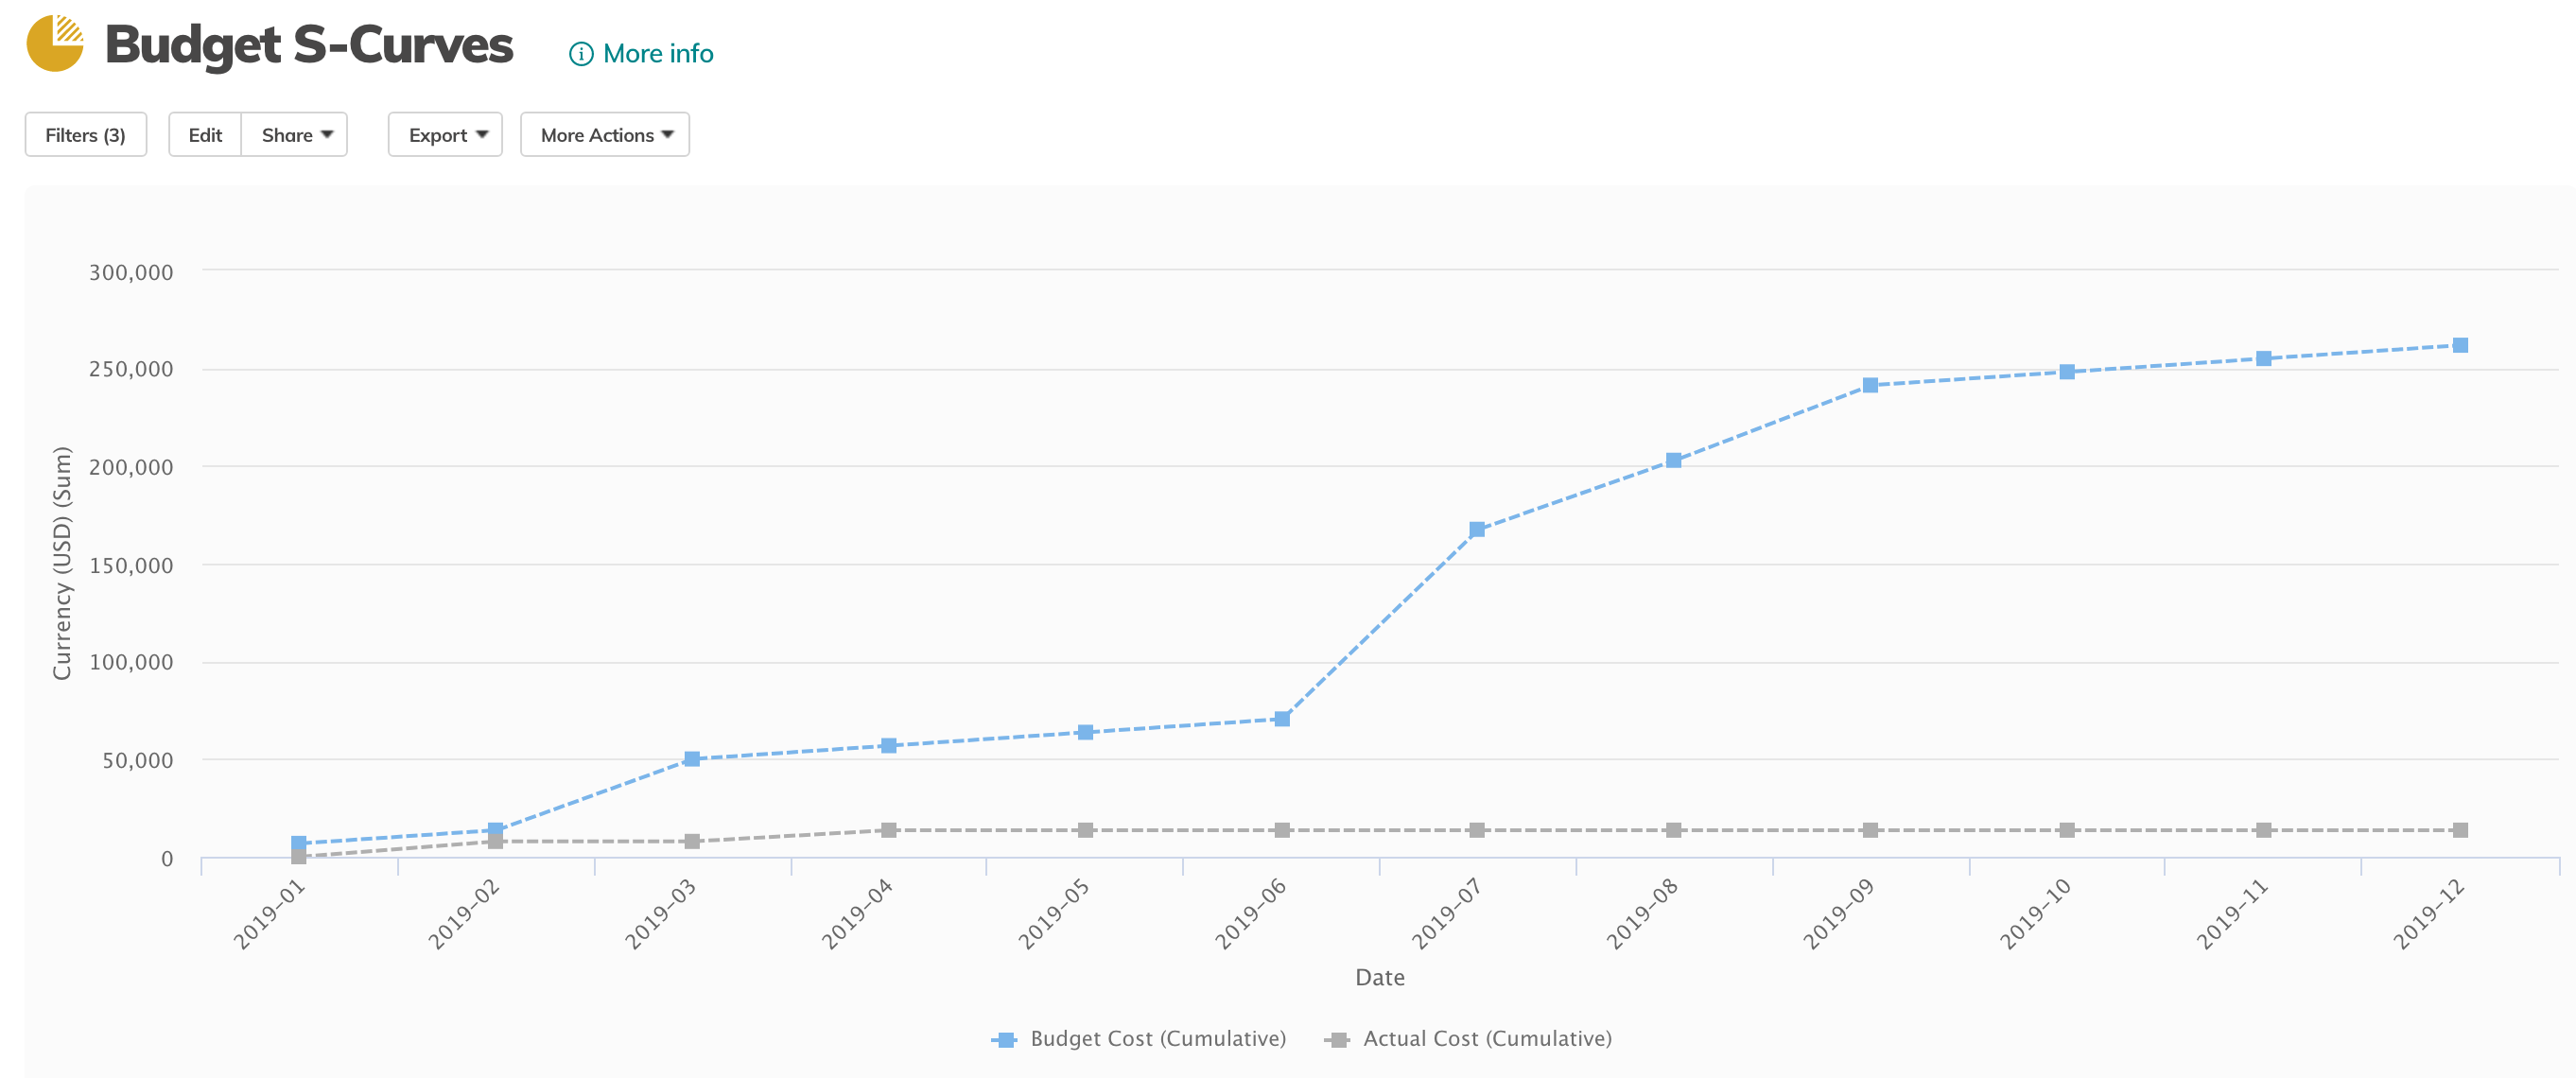
Cumulative lines are especially useful when combined with timephase data sets such as those in Project Financial Resources or Labor Resources data sets. Traditional Project Management methods commonly use cumulative data in "Earned Value graphs" or "S-Curves", to chart costs plans & actuals over time.
Visualizing cumulative cost and revenue projections for a project helps you understand:
- when forecast costs incorporating actuals deviate from budgeted costs
- when revenues are forecasted to meet targets
- when you will need to request more funding
Additional Use Cases
Cumulative lines are not limited to comparing timephase data sets.
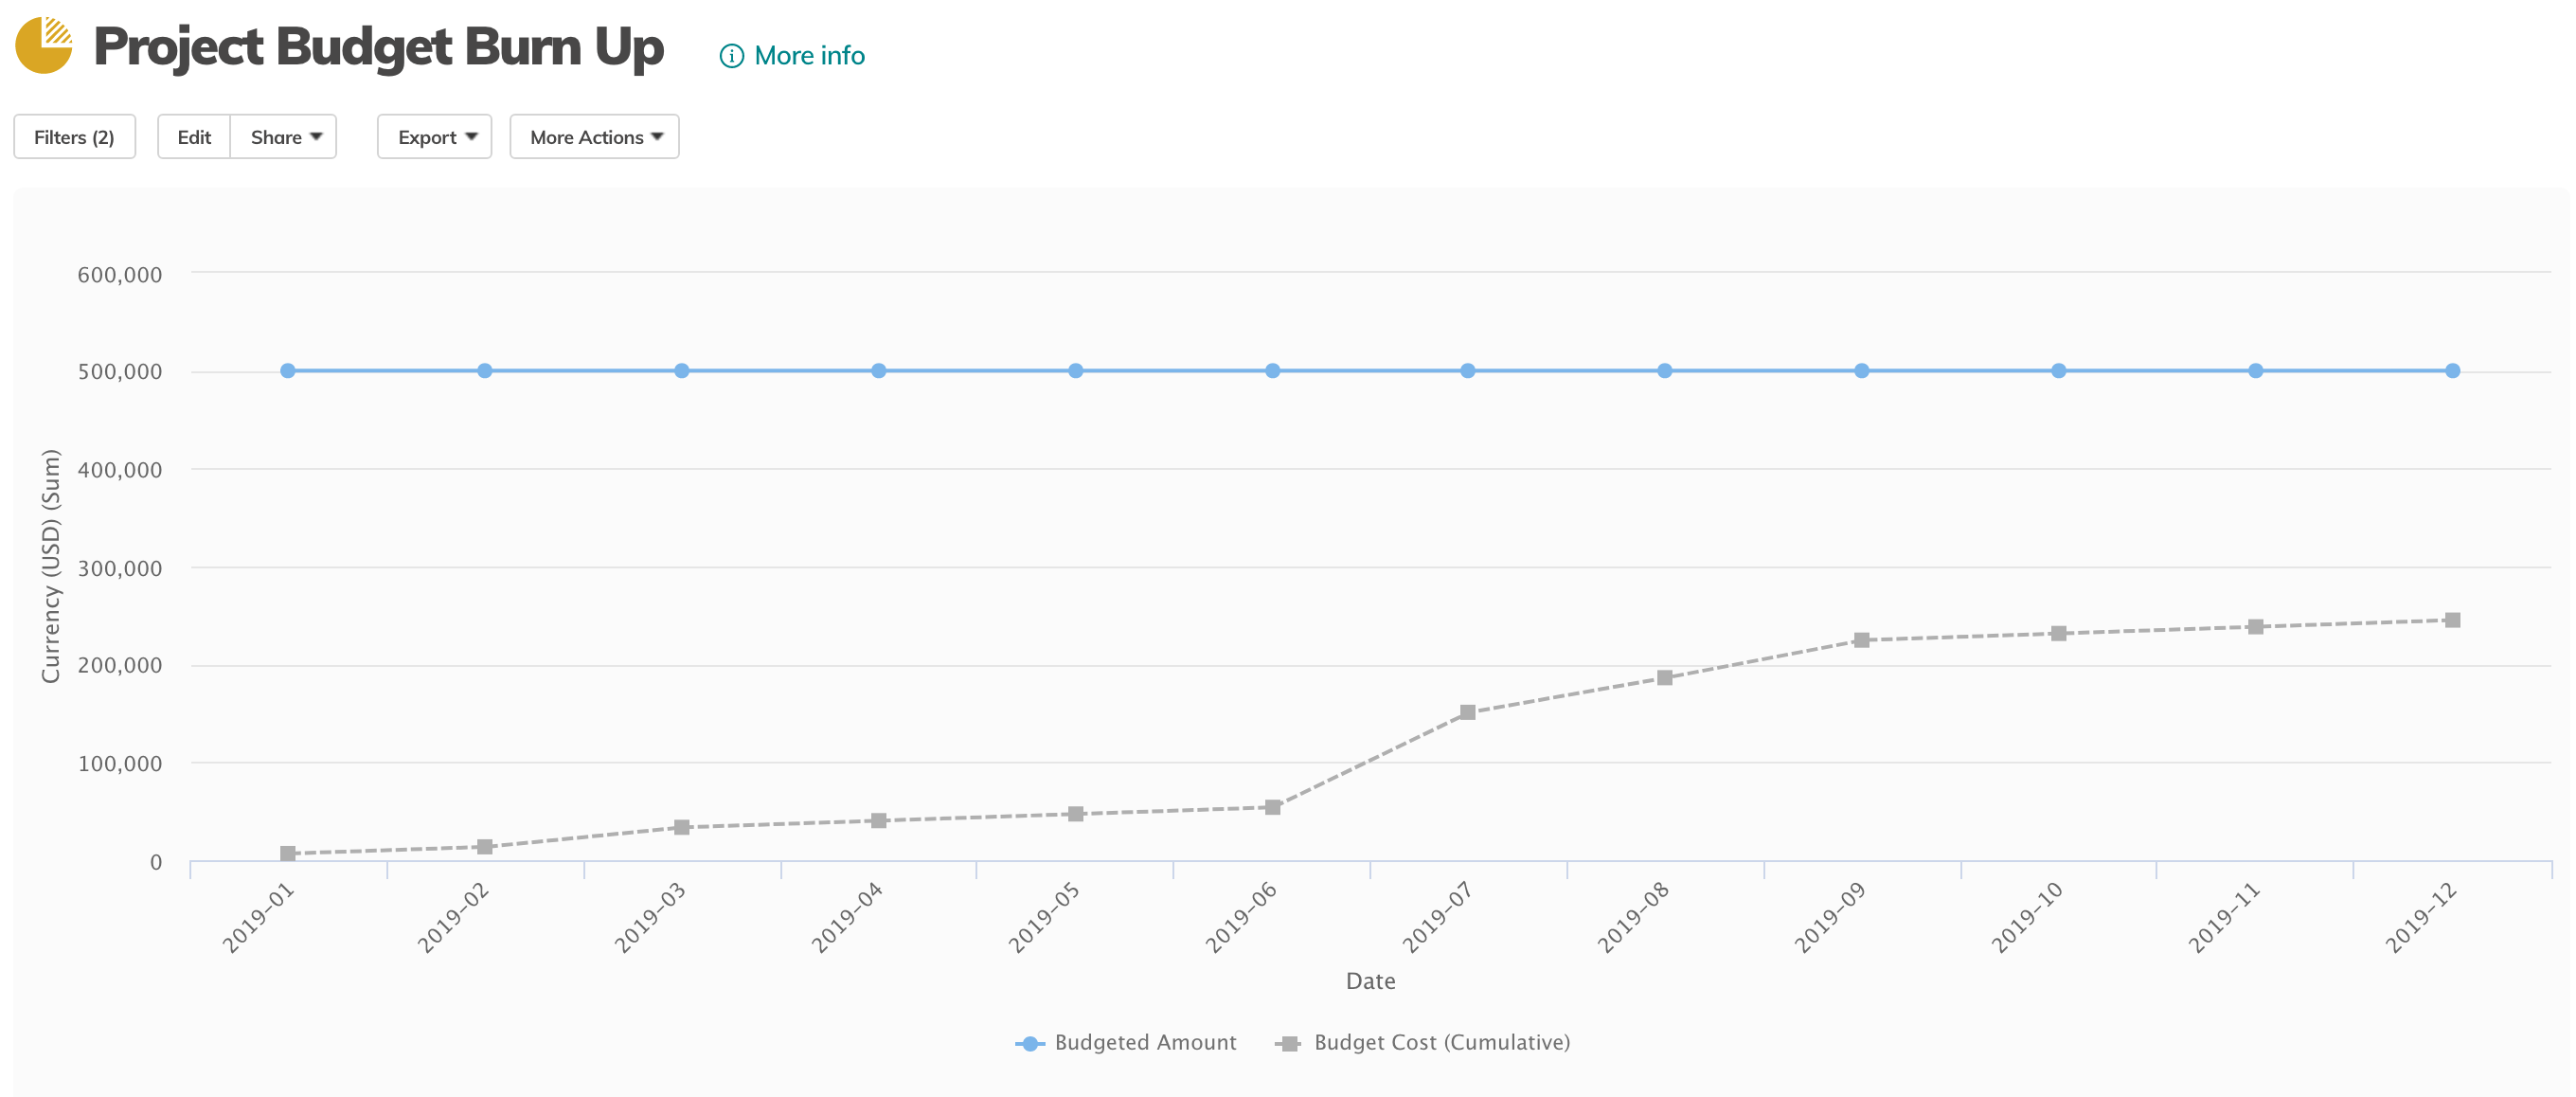
You can combine cumulative data and single values in a chart to visualize monthly burn up to total threshold amounts, for example:
monthly cumulative "Budget Cost" driven by a project's detailed work plan
vs the project's "Budgeted Amount" top-down funding.
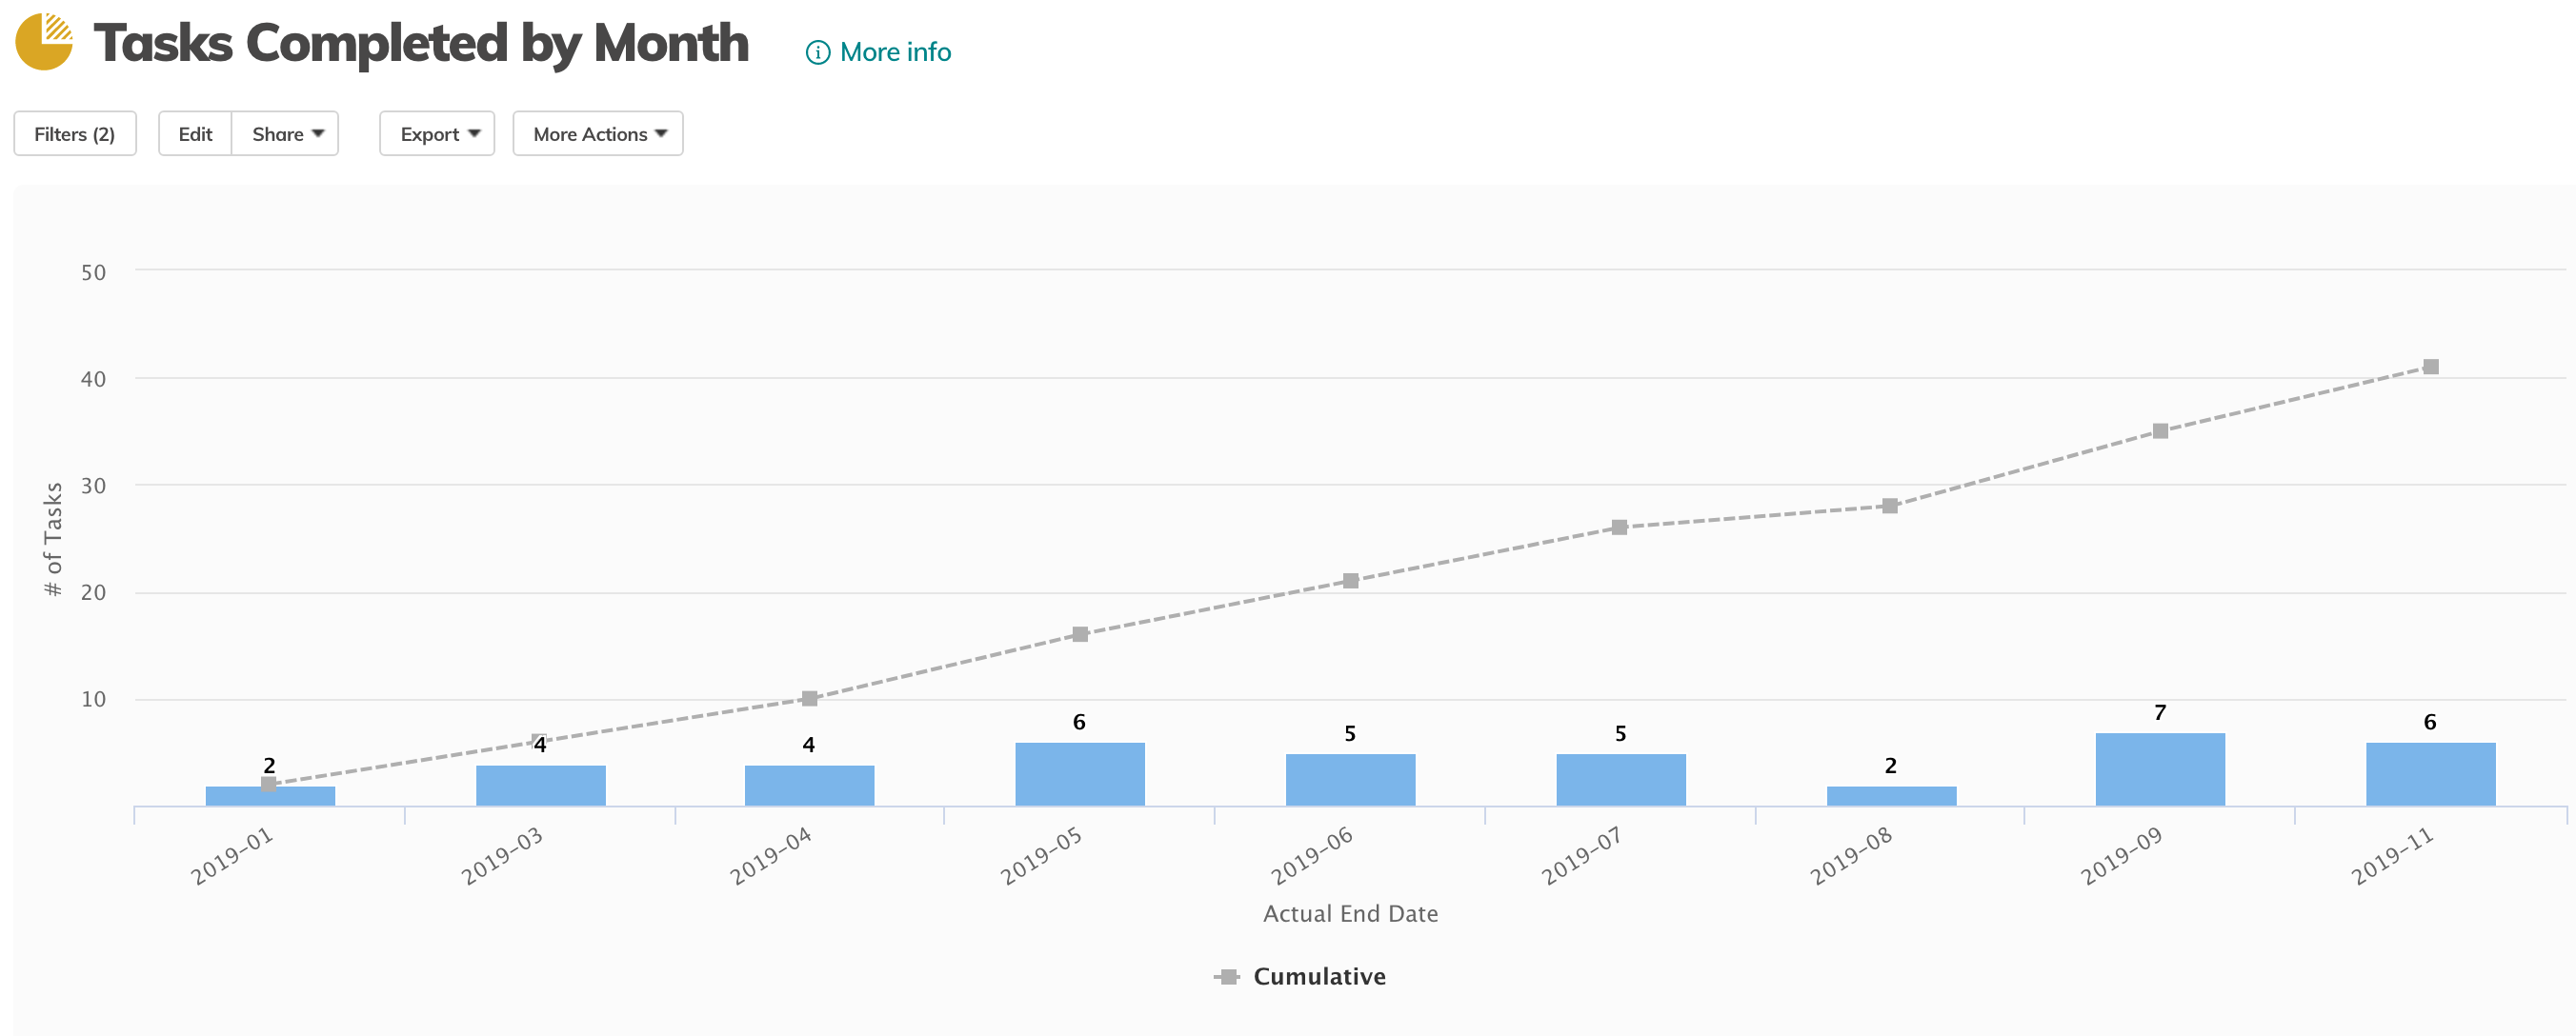
Add cumulative lines to standard bar charts to better visualize:
- Count of Tasks completed by month by your team
- Requests submitted by a particular team/ customer per month
How it Works
Cumulative lines can be added to any report line charts or standard bar charts when
- the X-axis is grouped by date
- the y-axis is one of:
- currency
- numeric
- duration
- toggle
- percent
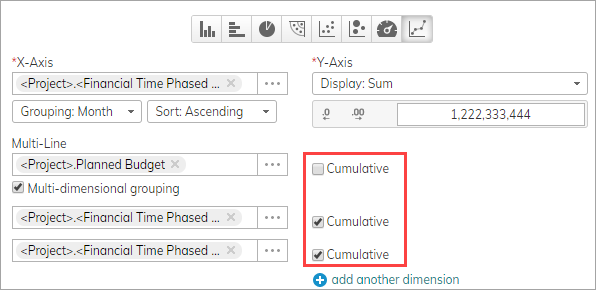
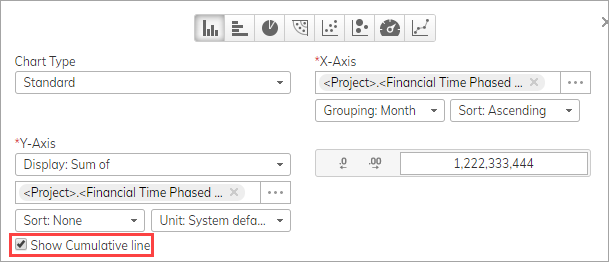
Now you can select the Cumulative checkbox(es) to aggregate y-axis values.
Note: you will need to have enabled "Enable Financial Planning" system setting to access "Financial Resources" data and "Enable Resource Utilization Reporting" to access the "Labor Resources" data.
To build s-curves based on timephase financial (cost or revenue) data, your report must be set up like this:
- includes Financial Resources or time-phased data

Line chart
Bar chart (Standard type only)
Project Costs S-Curve chart