
Bubble and Scatter Charts - Overlap Detections
What's new?
Enhanced clarity to help you better understand the Bubble and Scatter charts.
Benefits
When presenting your project details in Bubble and Scatter charts we would like you to gain as much knowledge from the data as possible. Therefore we have now enhanced the clarity in these charts. The bubbles are spread out in the manner you are familiar with however you will only see one title per bubble cluster.
How it works
Below are two figures representing the old and new Bubble and Scatter charts.
Figure 1 Old View
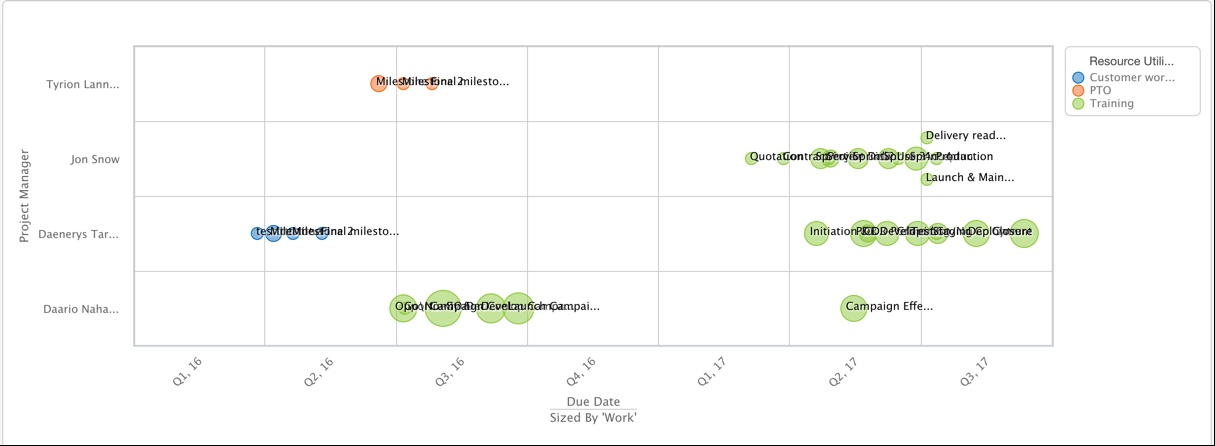
As shown in the figure above, it is difficult to read the individual bubble titles.
Figure 2 New View
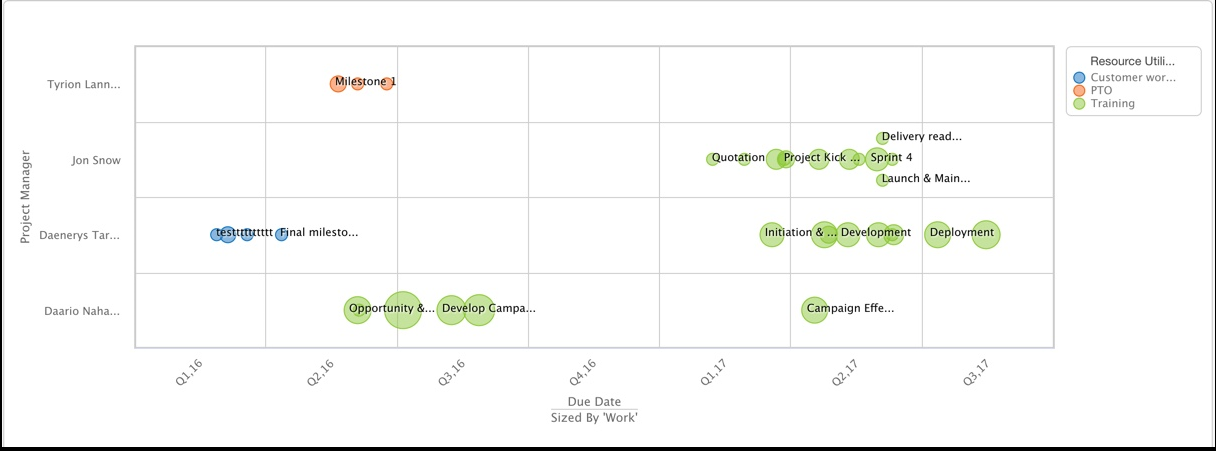
As reflected in the figure above, the enhanced view makes it easier to understand the information represented by each bubble as there is no overlapping text.
Please note:
- There may still be multiple bubbles in one location however the cluster will only reflect one title.
- This enhancement is OOTB therefore no configuration is required.