
04. Building the Presentation
Building a template is a one-time task after which the template can be used with any relevant project each time you publish a new presentation. You can create multiple templates, for example: Project Update, Portfolio Status and so on.
Step 1. Log in and select the template file
You can create your own templates using your company-branded presentation as a basis, or make use of the sample presentation templates:
- 4 Box Status Update
- Customer-Projects – for customers with linked projects
- Meeting Notes – create a presentation with meeting note details including the participants, action items, and decisions
- Monthly Program Reporting Deck – for projects with subprojects
- New Project Request Deck
- Portfolio Projects – for portfolios with repeating slides for projects, programs, or programs and projects. Learn more.
- Portfolio Programs Projects – for portfolios with linked programs and their subprojects.
- Program Projects – for programs with subprojects
- Vertical Template - Use this portrait-orientation presentation to mimic documents, with larger text areas, smaller fonts and tables with more rows. The template is suitable for multi-page documents, and uses a standard 8.5 by 11 in letter format.
- Log in with your AdaptiveWork credentials.
Open PowerPoint (online and installed versions are supported) with the add-in enabled. Depending on your version, enable the AdaptiveWork add-in from the Insert or Add-Ins ribbon. - Open a template or your branded presentation.
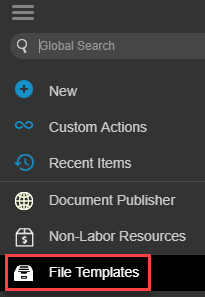
Tip: You can store and manage templates in AdaptiveWork, and download when needed. Access the templates from the navigation panel.
- Enter your user credentials.
Note: SSO is supported in Chrome and most desktop applications. For further details see SSO to Slide Publisher.
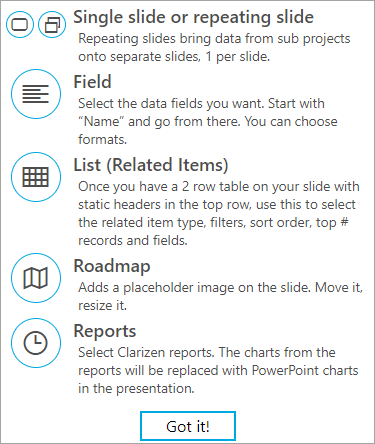
Click Got it! to begin creating your presentation.
Step 2. Select the presentation type and add data
- Select a main item type: Program, Project, Customer, Portfolio, or Meeting Notes to define a central theme and entity type for your presentation.
- Select Single slide or Repeating Slide. Select Single for data from the project level, and Repeating for data from sub Projects and Projects accessed via shortcuts. The slide will repeat itself for each sub project/shortcut with the respective data.
To return to this page, click Clear & New Slide Type from any page. - Select which data from AdaptiveWork to bring into the presentation as placeholders. You will copy and paste the placeholder tags into the presentation.
Notes: Like similar flexible template creation tools, the placeholders are represented by curly brackets / curly braces like this: {}. Additionally the right-side closing bracket "}" is a hyperlink and holds some additional metadata like format, sorting, filtering and must not be deleted or modified.
The font styling is determined by the “{“ character of the placeholder (the first character).
For Single Slide
Field
Select the field you want to present from the drop-down list. The field set includes all out-of-the-box fields for the Program, Project and Customer entities, and custom fields used by your organization.
Set the field format where relevant.
|
Field Type |
Format options |
Default value |
Limitations/ Notes |
|
Date |
|
|
|
|
Currency |
|
|
Numbers always appears with thousand separator |
|
|
||
|
|
||
|
Toggle |
|
|
|
|
Duration |
|
|
Values will not be converted to one unit. They will be displayed as they are in AdaptiveWork |
|
Numeric |
|
|
Numbers always appears with thousand separator |
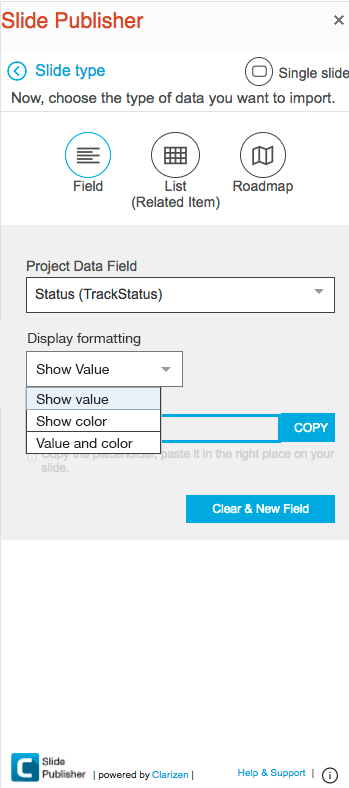
Tracking Picklist items has been enhanced with a Color format option. As in your AdaptiveWork projects, adding color boosts the visual aid of all reports.
The color format for items from your Picklist in SlidePublisher enhances visualization in addition to the text you are familiar with.
You can select how you would like to track your Picklist items as shown in the figure below. The Colors are pre-defined in the system settings by admin.
Notes:
- When selecting a field that has hops (such as RefToUser), they will be displayed in a new drop-down menu. For example, you can select Project Manager and then Name or email. By default, ‘Name’ is selected. Slide Publisher supports up to 5 hops.
To insert the placeholder in the slide, click Copy and paste it in the desired location on the slide.
Note: Ctrl + v may be the only method to ‘Paste’.
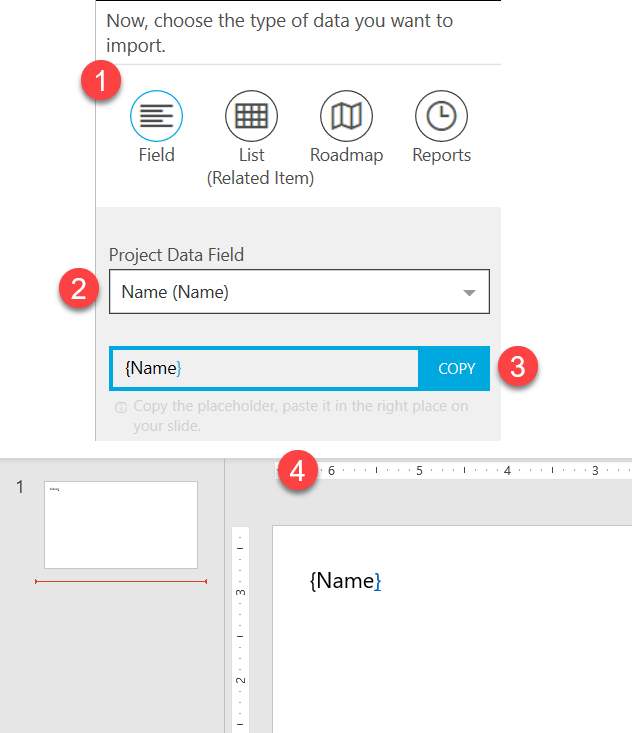
Example:
- Select a Field-type placeholder.
- Select the Project Data Field, such as Name.
- Click Copy.
- In your slide, paste in the placeholder.
You can edit the placeholder font, color or size in the slide itself, and it will be reflected in the presentation.
To add a new field, click Clear & New Field.
List (Related Items)
You can use related items and objects from reference to object fields (such as resources):
- in a simple, comma-separated list, for example in a text box
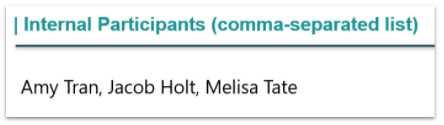
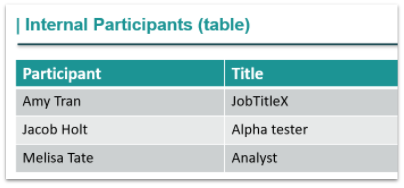
- in a table
For lists, paste the placeholder into the text element, such as a text box.
For tables, add a table with at least 2 rows into the slide. The first row can be your header, while the second is where you will paste the placeholders. Upon generating the presentation, the table will be populated with data from AdaptiveWork.
Select the related item you want to include from the drop-down list including data objects.
- For related bugs, issues, risks and requests, you have an option to select all items related to this Project, Tasks and Milestones (in AdaptiveWork, appears under ‘Targeted Cases’ panel), or items that are related ONLY to the project itself.
- Timesheets include all timesheets, tasks and milestones on that project.
Filter the list of items by any parameter.
- Slide Publisher supports ‘and’ between the parameters, however does not support advanced options for formulas and conditions.
- Some of the field types require a specific format of value when filtering by this field type.
- Slide Publisher does not include a drop-down menu to select from at this time, therefore there is a need to type it in manually.
|
Field Type |
Format options |
Limitations/ Notes |
|
Date |
MM/DD/YYYY |
|
|
Currency |
Number |
|
|
Toggle |
True/False |
|
|
Duration |
Number+ unit (h,d,w,m) |
|
|
Numeric |
Number |
|
|
Text |
text |
For names, picklists, etc. |
Set the number of items to display in a list, up to 25 items.
- Since PowerPoint does not support page breaks, we recommend limiting the number of items to prevent an overflow of slides. The default is 8 items.
Click Select Columns to add the column placeholders.
Select the field you want to present from the drop-down menu as a column in the table.
- The list of fields include out-of-the-box and custom fields from the related entity you selected.
- The same options as the ‘Field’ section are available here - fields and formats.
Sort the table by any column using the toggle, and select ascending/descending.
- Make sure only one column is selected for sorting before you copy and paste the placeholders into your slide.
- Multi-sort is not supported.
To insert the placeholder in the slide, click Copy and paste it in the desired location on the slide.
Note: Ctrl + V may be the only method to ‘Paste’.
Roadmap
Select the roadmap by clicking on the roadmap icon.
Define the parameters of the roadmap, which include dates, grouping, and the properties to represent in the project bar, indication dot, etc.
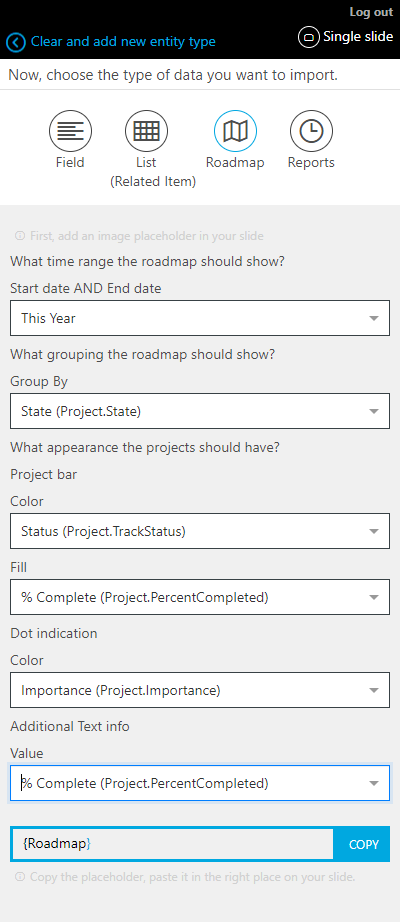
Best Practice: Please dedicate a full slide for a best fit display of the roadmap.
Reports
Include line, pie, bar and column charts from your AdaptiveWork reports in Slide Publisher presentations. The charts will be converted to PowerPoint charts.
Note about chart colors: Colors defined for custom picklists and some standard fields will be used in Slide Publisher charts. For fields where colors are not defined or cannot be defined, colors will not match.
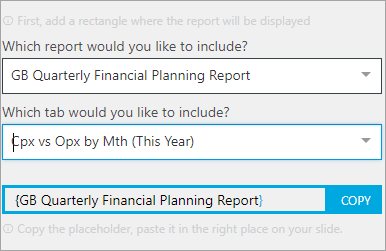
Prepare the slide that will include the chart by adding a rectangle shape to the slide. The rectangle will act as a placeholder for the chart that you are going to import from the report. Resize and position the rectangle according to how you want to display the chart in the presentation.
Start typing in the name of the report to select the report, and then the tab in the report where the chart is located.
Additional options for Reports
- Runtime filters - You can add runtime filters in Slide Publisher. Add Reference to Object fields, picklists/multi picklists, toggle on/off, dates, the current customer, etc.
- Filter charts based on the Project/Program from where you publish the slides. This feature can also be used for repeating slides with charts from your sub-projects. Use the Current Project option in the runtime filters to include a chart based on the project. Read more
Click Copy, and then paste the chart in the rectangle that you previously added to your presentation. Save the PowerPoint presentation and upload it to AdaptiveWork as a new template or replace an existing template.
For Repeating Slides
Select Repeating slide when you want to include sub-Projects and Projects from shortcuts in your presentation, and have detailed data for each sub-Project.
Filters can be applied on repeating slides to set which sub-projects / shortcuts will appear in the presentation (optional).
Once filters are set, to indicate this is a repeating slide, click Copy and paste in the top left corner of the slide.
To add placeholders for fields, tables and roadmaps, follow the same steps as the single slide.
- You are confined to a maximum of 50 repeating slides.
- The slides are sorted by creation date in ascending order.
Step 3. Editing
To edit a placeholder or table, delete the placeholder/table from the slide and create and paste a new one from the Slide Publisher Add-in.
When your presentation template is ready, upload it to AdaptiveWork and publish.