
Program and Project Roadmaps
Introduction
Program and Project Roadmaps provide managers and executives with an interactive visualization tool to review and assess their strategies.
The Roadmap is a flexible tool, suitable for different use cases, which include:
- For Agile frameworks, view by Epics , or by features and drill down to the Epics
- For Waterfall frameworks, view all Projects and sub-Projects
- For frameworks that combine different modes of work, such as Agile and Waterfall, sort the view by Teams and then group by Epics or features
Note: Tasks are currently not supported.
Jump to:
Accessing Roadmaps
You can access the Roadmap from within the Program/Project view. The Roadmap inherits the same permissions as the Program/Project. You will be able to view roadmaps if you can view or edit the Program/Projects.
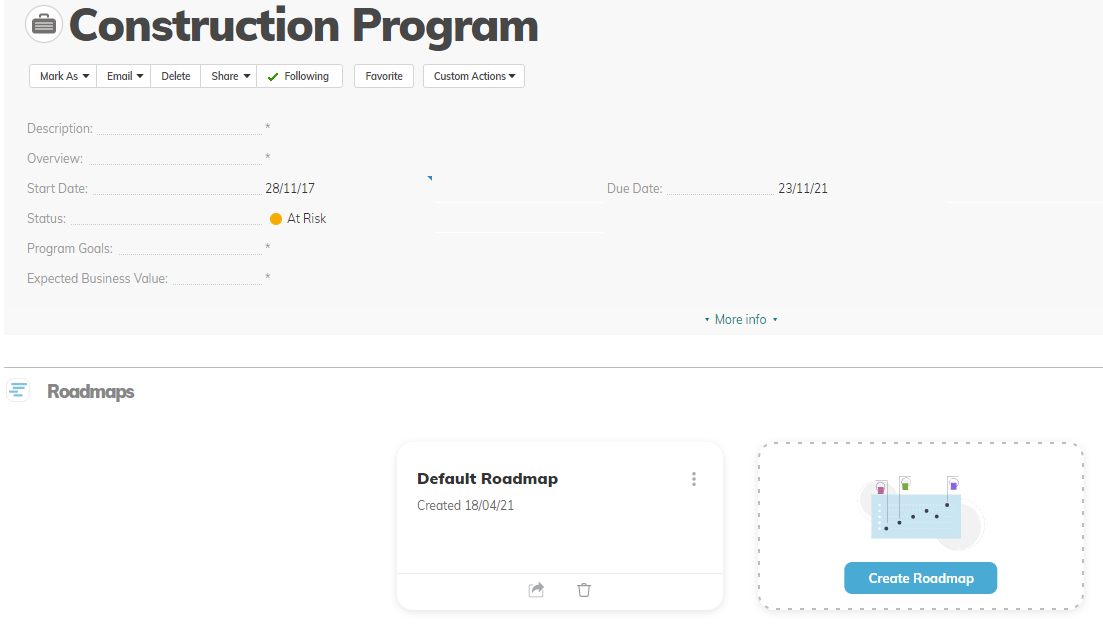
A default Roadmap exists.
The Default Roadmap displays the Project's start and end date with Milestones displayed. No grouping is applied.
You can edit the Default Roadmap as well as create another 3 Roadmaps.
Sharing Roadmaps
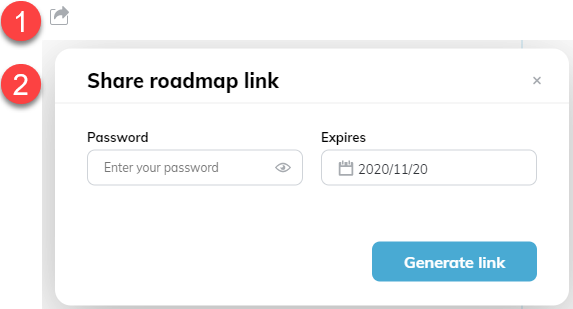
Click on the share icon to share the roadmap with other Users in the organization that may not have permission to view or edit the Program/Project. When shared, the roadmap view is accessible to the user by clicking the Roadmap link. We recommend adding a password for security purposes.
Creating Roadmaps
To generate a Roadmap:
- In the Roadmap panel, click Create Roadmap, and enter a name for the Roadmap.
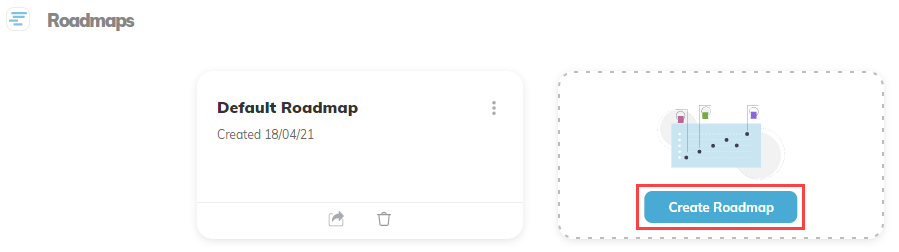
- Optional - Select an attribute to group by. You can do this also later in Roadmap Settings.
- Click Create.
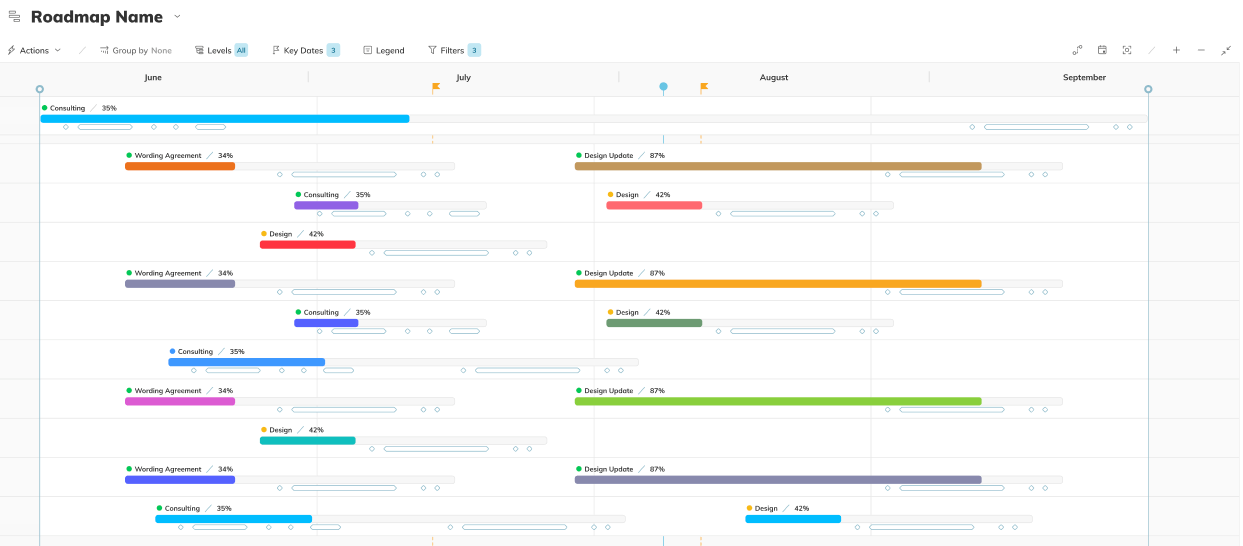
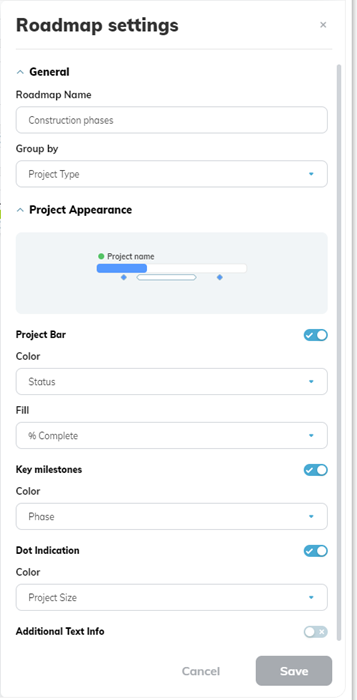
In the Roadmap, the bars represent Projects and sub-Projects (up to 3 levels). The bar color is set by default to the Phase, and the opacity is applied based on Project % completion.
Note: If the bar color is grey, it means that the color hasn't been set for the Phase value. Please ask your Admin to update the color in Settings > Configuration > Projects > field values.
When generating a roadmap, the following rules will be applied:- The roadmap will scale automatically based on the start date and end date of the Program/Projects
- If there are no project values for the attribute you have chosen to group the roadmap by, the swimlane will be hidden.
-
When you add or remove projects or programs, the roadmap will be updated automatically. You can also refresh the roadmap manually with the Refresh action in the three-dot menu
Interacting with Roadmaps
The Roadmap is a visualization tool that helps you make the right strategic decisions for your Program and Projects. You can view more details for your projects, customize the Project bar display, filter the view, or add key dates.
Accessing Project Details
For a quick overview, you can hover over the Project.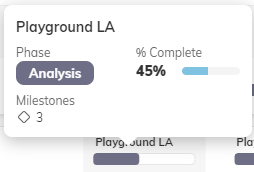
To view more details, click on a Project bar. The Details panel displays the Property Card set by the AdaptiveWork Administrator for your profile. Click Related items to see Milestones.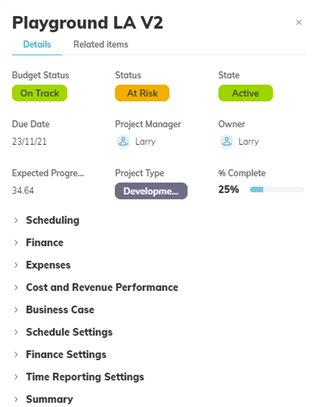
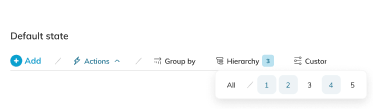
Actions Menu and Settings
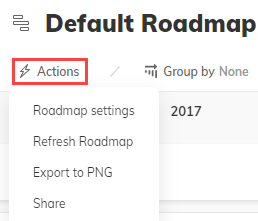
Click Actions to:
-
Roadmap Settings: Click Actions > Roadmap Settings to set up and edit Roadmap options. These include which elements to display, grouping, and which properties to highlight.
- Refresh Roadmap: Click Actions > Refresh Roadmap to refresh all the data.
- Export to PNG: Export the Roadmap as an image in the PNG format.
- Share: Share the Roadmap by generating a link that you can send to colleagues. You can also add a password and expiry date for the link.
Selecting What to Display Using Hierarchies
Choose how many levels of the grouped by attribute to display, for example, only 2 levels of sub-projects.
Baseline Duration and Planned Duration Views
In Roadmap Settings, under Duration to Compare, you can add the Baseline Duration or Planned Duration to the view.
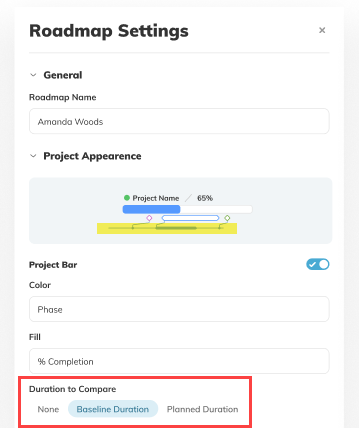
- Baseline - an additional bar under the Project bar shows the baseline start and due dates
- Planned - an additional bar under the Project bar shows the planned start and due dates
If Milestones are displayed, they are connected to the baseline.
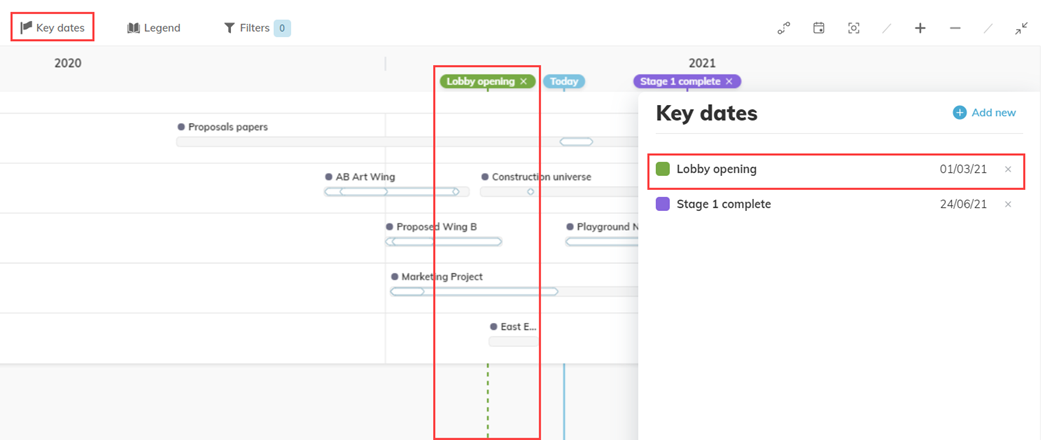
Key Dates
You can add key dates to reference important dates. These can be dates relevant to all Projects and sub-Projects throughout the timeline represented in the Roadmap. For each date, you can add a name and define a color.
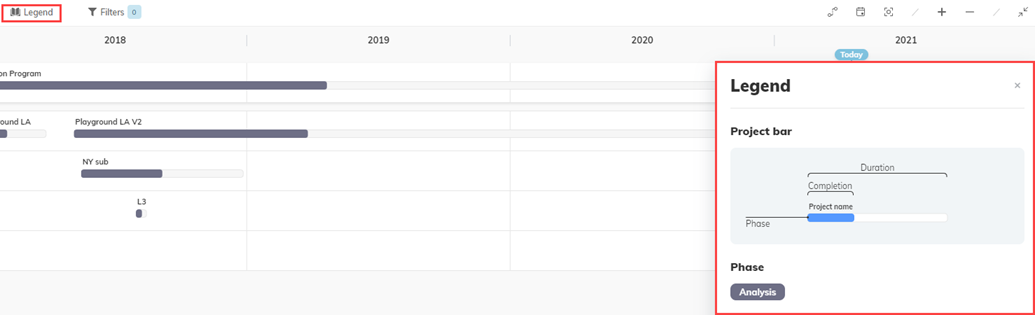
Legend
Click on the legend to see what everything means in the Roadmap. The Legend updates based on your Roadmap settings.
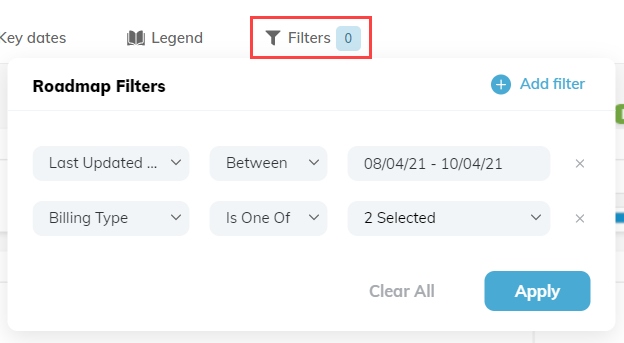
Filtering the View
Click Filters to add one or more filters. You can filter the projects displayed in the roadmap, for example, to show canceled projects or only projects at risk. Both standard and custom fields are supported for the following field types: Picklist, Dependent Pick List, and date.
Using Visualization Tools
When generating a roadmap, it will scale automatically based on the start and end date of the Program/Projects. The roadmap supports ISO week date calendar, and the date format is based on your organization settings.
Note: Standard Fiscal year is supported and indicated with a flag.
4-5-4 and 4-4-5 Fiscal Year options are not yet supported.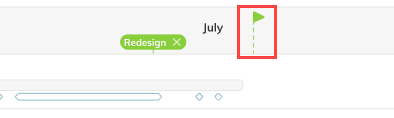
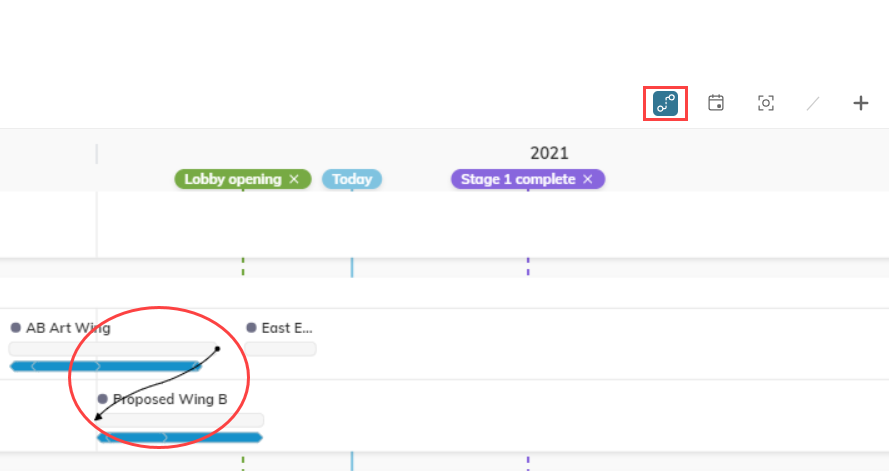
-
Dependencies: Click on the icon to show cross-project dependencies in the roadmap. Predecessors and Successors will be displayed in the Property card and in the Project tooltip.
-
Go to date: You can select a date to start the timeline on a specific date.
The today marker (date) will be displayed in the Roadmap when scaling or zooming. If the marker is not displayed in the chosen scaled view, you can jump to Today's date using the Go to date option.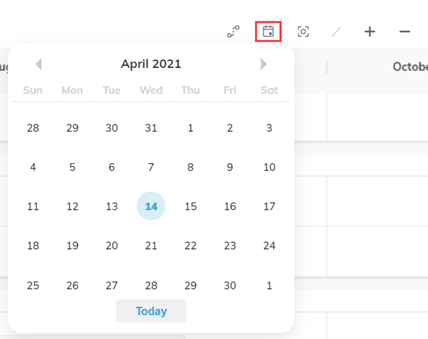
-
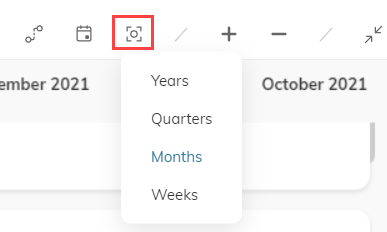
Manual scaling: Click on the scale icon to defined a scale: weeks, months, quarters, or years.
- Zooming with automatic scaling: Use the +/- buttons to zoom in or out to show more or less of the timeline. The scaling will adjust automatically.