
AgilePlace process flows
Overview
This guide provides an in-depth walkthrough of how organizations can use Planview AgilePlace to support agile program management at scale. Learn how to plan and deliver work across multiple teams using program increment (PI) planning, Kanban boards, and built-in analytics. Whether you're aligning strategy to execution or tracking team progress, you'll find the processes, reports, and best practices needed to support effective cross-team collaboration.
New to agile program management? Watch the demo video for a quick overview of how AgilePlace helps you connect strategy to delivery across teams of teams:
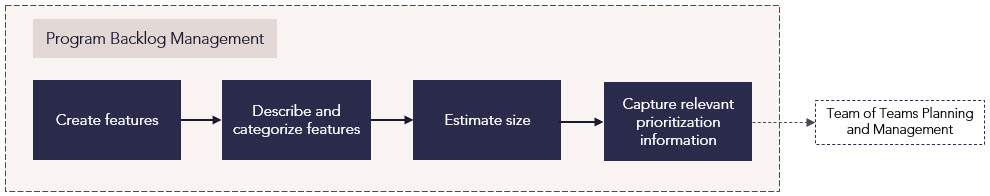
Program backlog management
Process steps
| Process step | Description |
|---|---|
| Create features | Break epics down into discrete features for the teams to break into stories. |
| Describe and categorize features | Clearly define a goal for each feature that teams can work toward. |
| Estimate size | Realistically assess the scope of the work that will be required to complete each feature. For more information: |
| Capture relevant prioritization information | Rate each feature using criteria to determine how much value the feature will deliver and how long the feature will take to complete. |
Reports
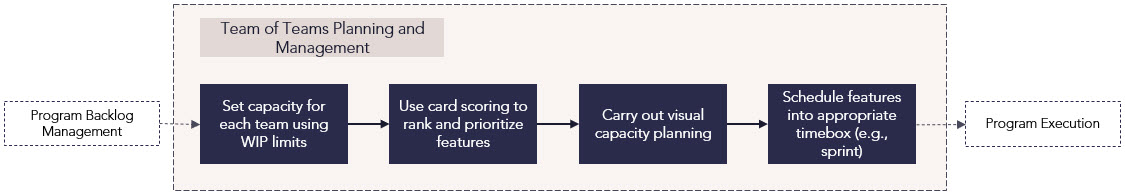
Team of teams planning and management
Process steps
| Process step | Description |
|---|---|
| Set capacity for each team using WIP limits |
Create work-in-progress (WIP) limits for each timebox, such as program increments, to set reasonable expectations for the capacity in each timebox. For more information: |
| Use card scoring to rank and prioritize features |
Add cards with work you want to evaluate to the Card Scoring panel in AgilePlace, and select a metric or custom template to measure cards against the criteria most relevant to your team's purpose. |
| Carry out visual capacity planning | Using the previously defined WIP limits, schedule features for specific timeboxes, such as program increments (PIs). |
| Schedule features into appropriate timebox (e.g., sprint) | Schedule the feature cards into available timeboxes, such as program increments (PIs). Use the Agile Planning Series view to visualize how planned work at the program-level aligns to a higher-level planning series, such as a quarterly increments. |
Reports
|
Analytic Report |
This report allows you to see scheduled work items within your AgilePlace board in a timeline view. Work items can be grouped or filtered by assigned user, planned or actual start /finish dates, priority, and other attributes. |
|
|
Analytic Report |
This report allows teams to quickly identify work items that have issues in the Not Started or Started area of their board so they can address the issues in a team meeting and get work flowing again. Possible exception types for work include blocked cards, missed start/finish dates, longer average cycle time, and inactive cards. |
|
| Flow Report | Analytic Report |
This chart displays the relative amount of work in progress for each lane or section of a board over time. Variations in the width of the colored bands indicate how smoothly work is flowing, and serve as a visualize indicator of potential bottlenecks or workflow constraints. Key takeaways at the top of the chart display the rate teams are adding, starting, and moving cards on the board during a specified date range. |
|
Analytic Report |
For organizations using a connected Planview Portfolios-Planview AgilePlace environment to manage work in a full value stream, these PowerBI reports visualize work and strategy information for value stream and epic analysis. The Value Stream Analysis – Work and Strategies dashboard includes metrics from both work and strategies in Planview Portfolios, and boards, cards, and tasks in Planview AgilePlace. |
How can we track capacity against WIP?
|
Analytic Report |
This burndown chart helps teams visualize progress on work that needs to be completed during a specific time period and gauge whether they’re on track to complete their planned work by the deadline. It also highlights how many cards or card sizes may be at risk of missing the deadline. This chart is helpful for team retrospectives to understand past performance and historical trends. |
Program execution
Process steps

| Process step | Description |
|---|---|
| Deliver features through underlying stories | Agile teams develop and complete user stories for the features to deliver business value. Features are complete when all underlying stories are finished. |
| Monitor progress through key results |
Associate relevant AgilePlace cards to the key results. The cards should represent the activities to be completed to achieve the key results. Periodically review the current state of key results to see whether teams are making progress toward the objective. |
Reports
Best practices
Create relationships between your deliverables
Use parent and child card features to gain visibility into how your work is connected and align teams’ work with higher-level strategies. This allows you to effectively manage your board, your work between related teams, and delivery of key results in your epic.
Work in shorter cycles
By planning work in increments, (typically two-week sprints), you can deliver value and maximize focus and flexibility. Shorter work cycles also mean you can receive and apply feedback from customers and stakeholders more quickly, so you can deliver what’s most important.
Foster collaboration between teams
Teams with interrelated work should coordinate and plan together to deliver work in unison. Emphasizing value over time efficiency encourages collaboration between teams and can lead to improved efficiency in their respective value streams. Using work-in-progress (WIP) limits to focus teams on a set number of active projects can further encourage cross-team collaboration to complete work or resolve any blockages.
Embrace continuous change
Making constant improvements is important for meeting changing conditions and continuously moving forward. Lean and agile metrics help assess how effective teams and teams of teams are in delivering value, while shorter work cycles help teams implement changes and feedback quickly.
Prioritize delivering value
When success in agile is defined by delivering value to customers, it’s important to prioritize work that is most closely aligned with what customers need. Align work to high-level objectives across all value streams to ensure teams and teams of teams are working on what matters to customers.