
Portfolios process flows
Program portfolio planning supports a clear process for initiating new business requests, managing new programs, and progressing programs through execution and delivery. A high-level estimate of program costs and benefits are captured in the financial plan, and a strategic program roadmap is created to track progress on project delivery, business outcomes, and important program milestones.
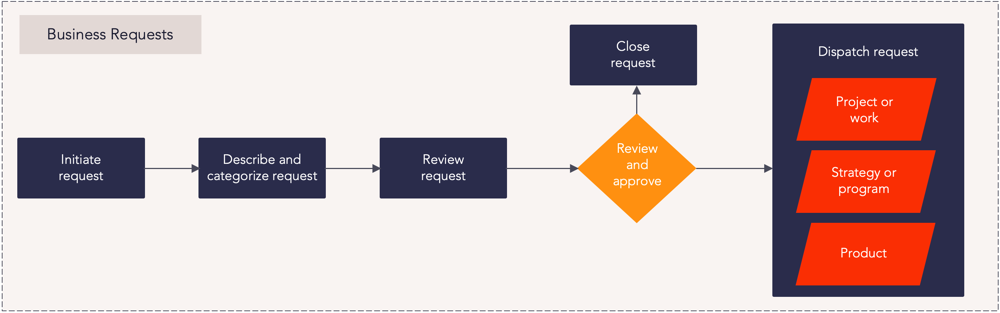
Business requests process steps
| Process Step | Description |
|---|---|
| Initiate request |
Requests provide one way that new entities – such as projects, programs, products – can be initiated in Planview Portfolios. This allows incoming requests to be well-defined, categorized, and assigned to the right area for delivery. This also allows requests to be evaluated against each other to compare scoring, impacts, and alignment. When a new request is created, certain fields will be required to ensure the data needed for appropriate categorization is provided. Request assignment and any lifecycle steps will start following your defined governance process. For more information: |
| Describe and categorize request |
During the initiation of a request, information is populated into Planview Portfolios to describe and categorize the request within the register. Often a minimum level of required categorization or descriptive information is enforced during the creation of the request via a lifecycle workflow to satisfy the specific data and information needs of the organization. For more information: |
| Review request |
The purpose of this step is to review and analyze the request in preparation for dispatch. Once you have a request portfolio, you can see detailed information regarding the requests that are included in your portfolio on the Portfolio Manager tile within the Request Portfolio View screen.For more information: |
| Dispatch request |
The purpose of this step is to connect the request with a relevant entity in Planview Portfolios. This can be achieved by either dispatching the request, which generates a new entity, or by associating it with an entity that already exists. Planview Portfolios can route requests to a dispatcher, who is the user responsible for evaluating the requests and then performing the following tasks. Depending on whether your system configuration supports request lifecycles, a dispatcher can perform those tasks through request lifecycles or from the Request View screen without the use of lifecycles. The dispatcher can:
For more information: |
| Close request |
If approval is not granted or the request is no longer needed, change the status to closed. This provides a record of its status for reporting and ensures that no further updates can be made to the request. Depending on the internal business process, the process to close the request can vary and may contain approval gates in a lifecycle workflow. In these instances, successful completion of the lifecycle steps by the relevant users will automatically close the Request. The status of the request can be changed in the Request Detail screen, or directly in the Portfolio Manager using an appropriate column set selection. For more information: |
Business requests reports
How are we able to see requests and their details?
|
Requests Portfolio – Portfolio Manager – Customizable Column Set |
Tile |
This tile allows you to see request data in a customizable column set with data such as start date, status, and more. |
|
Requests Portfolio – Active Requests |
Tile |
This tile shows you active requests in the portfolio. |
|
Requests Portfolio – New Requests |
Tile |
This tile shows you new requests in the portfolio. |
|
Requests Portfolio – Pending Requests |
Tile |
This tile shows you pending requests in the portfolio. |
|
Analytic |
This report allows you to analyze work requests by category, originating business unit, or any configured single select work request structures. |
|
|
Analytic |
This report provides a count of request attributes to help you analyze the portfolio. The report allows you to choose which attributes are used to slice the data. |
How are we able to understand the approval status of requests?
|
Requests Portfolio – Active Requests |
Tile |
This tile shows you active requests in the portfolio. |
|
Requests Portfolio – Dispatched Requests |
Tile |
This tile shows you dispatched requests in the portfolio. |
|
Requests Portfolio – Closed Requests |
Tile |
This tile shows closed requests in the portfolio. |
|
Analytic |
This report allows you to analyze the speed of requests through the intake process, from the creation of a work request to dispatch into a new project or program. It can be analyzed by business unit or any configured single-select work request structures. |
|
|
Analytic |
This report shows the status of work requests. You can adjust the parameters to slice the data by category, status, and time horizon. |
|
|
Analytic |
This report analyzes changes in request status to aid analysis of throughput, volume, and cycle time. Further analysis based on request attributes such as work type or customer is also supported. |
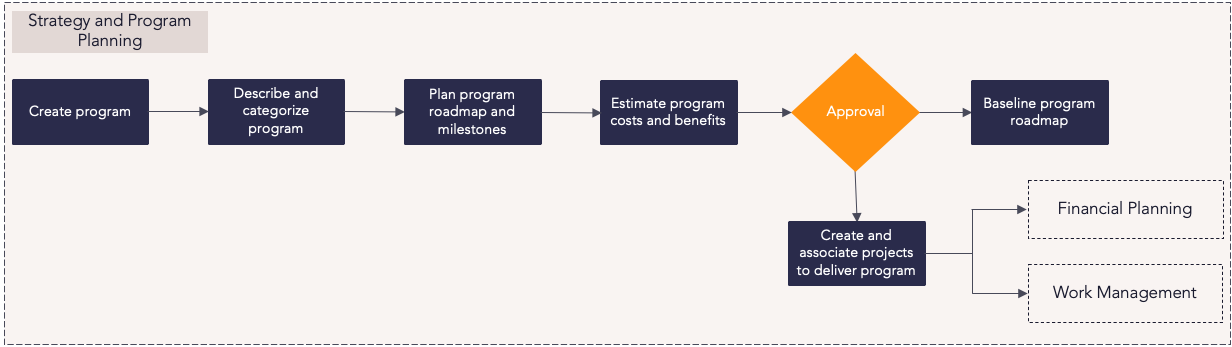
Strategy and program planning process steps
| Process Step | Description |
|---|---|
| Create program |
Strategic programs can be created from a request, from the Portfolio Manager screen, or directly entered. When a new program is created, certain fields will be required to ensure the data needed for appropriate categorization is provided. Program assignment and any lifecycle steps will start following your defined governance process. For more information: |
| Describe and categorize program |
Relevant description and categorization information should be captured through a lifecycle-driven configured screen during the creation of each new program. Program attributes can also be edited on the Strategy View screen of the program and can be viewed in Strategy Portfolio View. For more information: |
|
Plan program roadmap and milestones |
Milestones and releases at the program level are added directly from the Strategy View screen. The color of the displayed milestones and releases are specified in the Strategy Portfolio preferences. The program roadmap graphically represents the schedule of strategic entities, allocated work, outcomes, milestones, and releases of a strategic plan. At the program level, two sets of dates are visible:
Here are a few helpful tips for the roadmap planning process:
For more information: |
| Estimate program costs and benefits |
Capture a high-level estimate of the costs and benefits to deliver the program in the financial plan based on the need of your organization. Cost accounts can include labor, capital spending, and expense spending. In the initiation phase of a program, these costs will likely be high-level estimates entered into the financial plan by the program manager. Once programs are approved, the underlying projects required to deliver these programs will be planned and scoped. At this point, cost information can be rolled up from the projects to the program to provide a more accurate view of the program costs. For more information: |
| Baseline program roadmap |
Strategy roadmap baselines are snapshots of the strategy roadmap, including program target dates and actual or scheduled dates of associated entities or projects. The purpose of this step is to capture a strategy baseline as part of the program planning phase which represents a record of the roadmap dates of the program at the time of program approval. For more information: |
| Create and associate projects to deliver program |
Projects provide a way of planning and managing the schedule and resources required to deliver segments of work that, together, constitute the delivery of the program. Following the approval of the program, the underlying projects required to deliver these programs can be planned and scoped. The program manager will work with the relevant project manager/s to achieve this. To create projects, start the process of creating a new work entity in the program's action menu. Creating a project directly against the program automatically creates the association with the program. Creating a project requires a manual association to the program after the entity has been created. When a project is associated to program(s), an allocation percentage is defined. This allocation percentage is used to roll up the project's cost to its associated program(s). For more information: |
Strategy and program planning reports
How are we able to review the details of a portfolio of programs compared to each other?
|
FastTrack Power BI Showcase Dashboards – Strategy – Strategy Portfolio Balance |
Power BI Dashboard |
This dashboard counts the strategic initiatives and programs in select portfolios by the line of business, sponsorship, and initiative drivers. You can slice data by portfolio and view an overall status assessment for each project. |
|
Dashboard |
This dashboard provides visualizations of the project pipeline, strategic initiatives or programs, resource utilization, outcomes, and project health. |
|
|
Dashboard |
This dashboard helps you to quickly assess strategic plans against targets and across key factors by visualizing whether the latest plans meet revenue, cost, and margin targets. This information allows you to analyze cost and revenue breakdowns by missions and objectives, geographic regions, and markets. You can also evaluate performance against targets, incoming pipeline by region, and return by market. |
How are we able to review the program roadmap?
|
Strategy Portfolio – Portfolio Manager – Roadmap Column Set – Hierarchy View |
Tile |
In the Strategic Portfolio – Portfolio Manager Tile – Hierarchy View, toggle the Roadmap Column Set to display the current and baseline roadmap schedule, stages, and milestones. |
How are we able to review program financials?
|
Strategy Portfolio – Portfolio Manager – Customizable Column Set |
Tile |
This allows you to see strategy data in a customizable column set, including roadmaps, financials, effort, and more. |
|
Analytic |
This report identifies programs forecasted to underrun or overrun approved budgets. Budget variances are measured against the program's financial baseline and forecasted end dates. |
|
|
Analytic |
This report compares versions of the strategic program and summarized portfolio financial plan data, with effort represented as FTEs, days, and hours, and financials as cost, benefits, and revenue. A burndown chart is included for the portfolio and each initiative. You can run the report against each level in the strategy structure. |
How are we able to view changes, risks, and issues associated with programs?
|
Analytic |
This report provides a change request log summary for a portfolio of programs. This matrix is used to classify change requests by two parameterized attributes and is drillable, allowing you to slice the list. It includes key change request fields, attributes, ownership, and date information. |
|
|
Analytic |
This report provides a risk registry summary for a portfolio of programs. This matrix is used to classify issues by two parameterized attributes and is drillable, allowing you to slice the list of risks. The report also includes a table that shows key risk fields, attributes, ownership, and date information. |
|
|
Analytic |
This report provides an issue log summary for a portfolio of programs. This matrix is used to classify issues by two parameterized attributes and is drillable, allowing you to slice the list of issues. The report also includes a table that shows key issue fields, attributes, ownership, and date information. |
How are we able to understand programs and investments across our organization and their status?
|
Analytic |
This report summarizes key data points relating to the investment programs of the organization. The report can be configured to show specific attributes, fields, dates, and financial plan measures associated with each strategic entity. |
|
|
Analytic |
This report provides you with a count of the strategic initiatives or programs in a portfolio, allowing analysis by a primary and secondary attribute. |
|
|
Analytic |
This bubble chart plots prioritization, cost, benefit, revenue, and effort measures against strategic initiative or program status dimensions. For example, it can provide a value vs. cost visualization of the portfolio pipeline to show lifecycle stage and strategic alignment. |
|
|
Analytic |
This analytic summarizes data in an investment planning portfolio scenario by providing a time-phased view of the portfolio demand and targets. Portfolio demand is compared to the capacity of resources or funds required to deliver the portfolio, or to the benefits/revenue the portfolio must deliver. This analytic supports project, strategy, and product-based portfolios. |
|
|
Analytic |
This dashboard helps you to quickly assess strategic plans against targets and across key factors by visualizing whether the latest plans meet revenue, cost, and margin targets. It also allows you to analyze cost and revenue breakdowns by missions and objectives, geographic regions, and markets. Using this information you can evaluate performance against targets, incoming pipeline by region, and return by market. |
Program governance demo
Program governance process steps
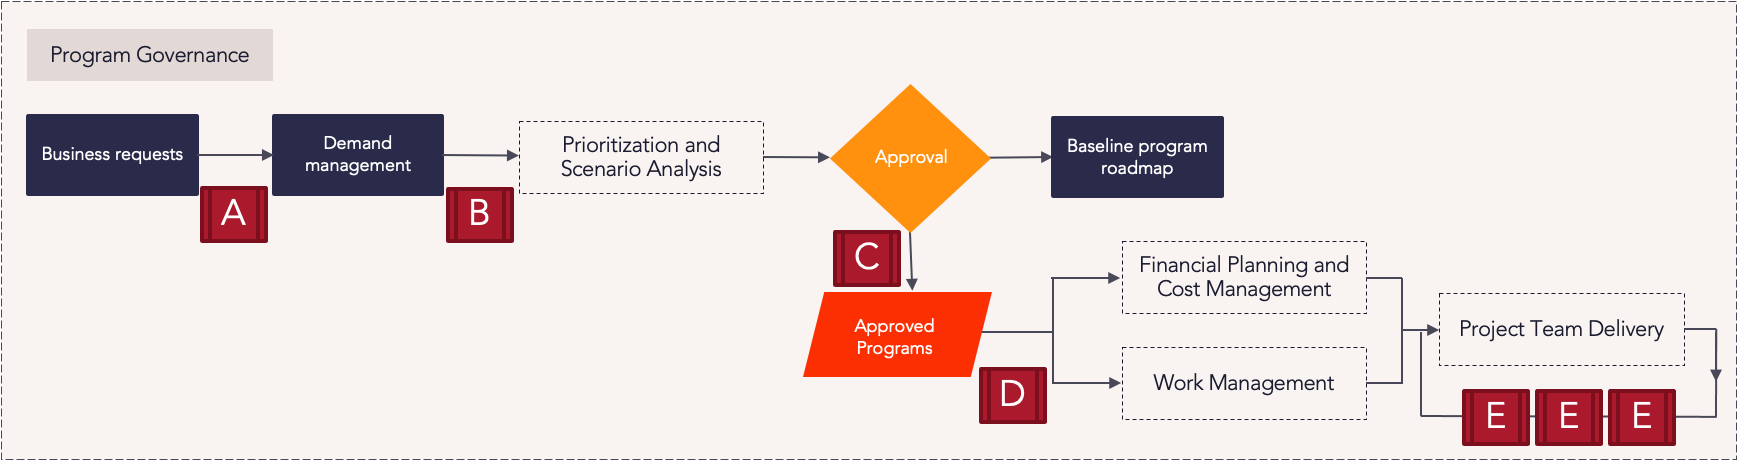
| Process Step | Description |
|---|---|
| Governance point A |
Request intake information is reviewed and, if approved, new projects or programs are created. |
| Governance point B | Initial program planning information, such as description and categorization attributes, cost and benefit estimates, and roadmap dates, are captured and reviewed to determine if enough is known to proceed with the program and include in the detailed portfolio planning process. |
| Governance point C |
The process of investment planning allows planners to prioritize and analyze the list of proposed investments (programs) to determine which to move forward with. Analysis of investments is achieved by comparing what’s available, capacity (which can be in the form of resource capacity or financial a budget against what is required) versus demand (derived by the forecast of programs in the portfolio). Planners will create and compare a number of investment planning scenarios to model different investment decisions and various approaches to balancing investment demand with capacity. Once an approach is chosen, these decisions are published as the agreed portfolio plan. |
| Governance point D |
Following agreement of the portfolio plan, the underlying projects required to deliver the approved programs can be planned and scoped. Initial project planning information, such as description and categorization attributes, cost and benefit estimates, and high-level schedule dates, are captured and reviewed before proceeding to the detailed planning of schedule dates, resource assignments, and project financials. |
| Governance point E | If required, projects can proceed through a gated governance process. Usually, each gate requires the project to comply with a checklist of activities/deliverables before proceeding to the next gate. |
Program governance reports
How are we able to view the alignment of programs to governing standards?
|
Strategy Portfolio – Portfolio Manager – Customizable Column Set |
Tile |
This allows you to see strategy data in a customizable column set, including roadmaps, financials, effort, and more. |
|
Analytic |
This report shows data on program status to help you analyze throughput, volume, and cycle time. The report can be run with and sliced by different attributes. |
|
|
Analytic |
This report shows data on program approval to help you analyze throughput, volume, and cycle time. You can adjust the report parameters to change the grouping and time horizon. |
|
|
Analytic |
This strategy portfolio-based report provides you with project status and data on projects associated to the programs and initiatives in the portfolio. |
|
|
Analytic |
This strategy portfolio dashboard provides you with charts and a data table of programs in the portfolio based on different attributes, to help you analyze the portfolio balance. |
How are we able to view the current state of programs in the stage/gate and approval process?
|
Strategy Portfolio – Portfolio Manager – Customizable Column Set |
Tile |
This allows you to see strategy data in a customizable column set, including roadmaps, financials, effort, and more. |
|
Strategy Portfolio – Active Lifecycle Steps |
Tile |
This tile gives an overview of lifecycle steps for entities in the strategy portfolio such as the user responsible, date, and accepted or rejected steps. |
|
Analytic |
This report analyzes program data and summarized portfolio financial plan data, with effort represented as FTEs, days, and hours, and financials as cost, benefits, and revenue. You can slice data by strategy attributes, account structure levels, or line attributes of selected accounts. The report can be configured to run against each level in the strategy structure. |
|
|
Analytic |
This report shows data on program status to help you analyze throughput, volume, and cycle time. The report can be run with and sliced by different attributes. |
|
|
Analytic |
This report shows data on program approval to help you analyze throughput, volume, and cycle time. You can adjust the report parameters to change the grouping and time horizon. |
Best practices
Optimize the request processManaging requests can be time-consuming. If you use requests, ensure that the process is as streamlined as possible by simplifying the submission process, using a standardized set of objective criteria to prioritize them, and having a designated person evaluate them.
Focus on strategyPrograms are about driving the organizational big picture. Make sure that as a program manager you’re keeping your eye on the initiative and strategy level and not getting too bogged down in details of specific projects or delivery tasks.
Use minimal governanceOrganizations can cut down on valuable time and resources by optimizing their governance processes with a streamlined and consistent “minimum viable governance” model. Project managers and teams must know where governance gates are and incorporate them into the planning process.
Don’t get mired in detailAt the program level, it can feel like you need to help put out every fire and that every problem will derail the whole program. Remember to be flexible, work with your managers, and be ready to adjust to get over the finish line.
Engage stakeholders proactivelyLike most things, the success of the program overall will depend on the support of sponsors and stakeholders. Be sure to keep them in the loop so it is clear the value the program provides to them, and that it feels easy to support in return.
Work with project managersYour success as a program manager depends on your project managers. Be aware when project managers are facing resistance and be ready to step in when necessary to help deal with stakeholders or explain strategy. Remain flexible and be sure to hear them out when it comes to obstacles, make adjustments when necessary, and ensure alignment and commitment if changes are made.
Demonstrate the visionA common miscalculation at the program level is to assume everyone understands the program’s value and connection to the overall strategy. Make sure the overall vision is communicated in clear terms to both stakeholders and team members alike, so they can see the value to themselves and the organization.
Know your risk levelIt’s important to understand your organization and the level of risk that will be considered acceptable for the program to keep running, as well as your own personal risk tolerance. Insecurity about risk can quickly derail a program – make sure you’re estimating conservatively and build in a level of risk buffer to avoid putting others or yourself on edge.