
Portfolios process flows
Overview
This guide provides a step-by-step overview of how organizations can use Planview Portfolios and the financial planning capability to forecast costs, estimate benefits, and build budgets that support strategic investment decisions. Learn how to develop business cases, track planned vs. actuals, and use reports and dashboards to monitor financial performance across portfolios, programs, and projects.
New to financial planning? Watch the demo video for a quick look at how to align budgets with business outcomes:

Process steps
| Process step | Description |
|---|---|
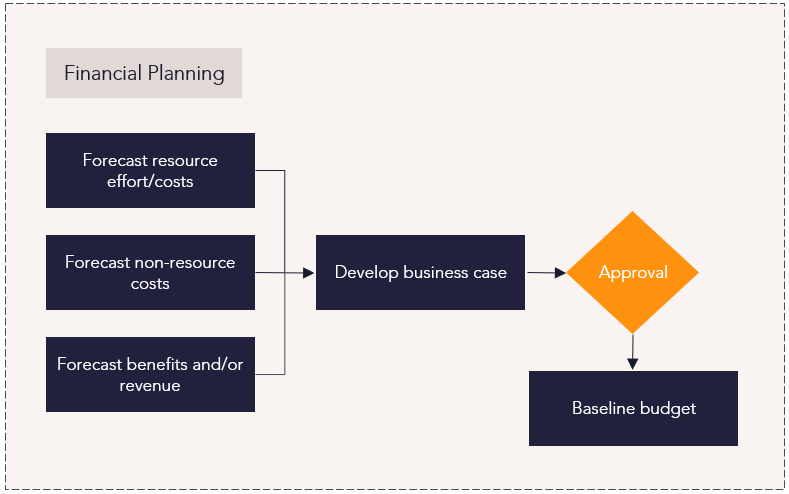
| Forecast resource effort and costs |
Estimate the high-level resource costs. Managers can plan resource costs by entering role-level demand directly into the financial plan in either FTEs or days. This demand is associated with certain resource details such as organizational role and location. The application then determines the costs of the resources based on their attribute categorization and estimated effort. For the purpose of balancing capacity with demand during investment and capacity planning, an administrator can load the capacity of a cost center-based financial plan for either a portfolio of cost centers, or all cost centers. Administrators can load this capacity immediately or schedule the load. |
| Forecast non-resource costs |
Estimate the high-level non-resource costs. Managers can use the Financials screen to enter this data manually, or use planned, unplanned, and actual expenditures attached to a project or task. |
| Forecast benefits and revenue | Estimate the financial benefit of delivering the work. |
| Develop business case |
Ensure the business case attributes are correct and current, which drive a business case analytic output. The business case can include forecast financial data, planned schedule and milestone dates, and the core attributes derived from the organizational data model. For projects, project managers can use the WRK13 – Project and Portfolio Business Case report to see a summary of key business case information on a single project or across a portfolio. |
| Baseline budget |
Build a budget by creating an initial estimate of costs. Managers can take a baseline of the financial plan to capture a snapshot of the original budget. They can then compare this baseline with future baselines to monitor progress. Financial baselines are created by copying the current forecast version to a baseline version. This can be done manually, or as part of a lifecycle step. For more information: |
Reports
How are we able to understand all cost and benefits forecast for programs, work, or projects across the organization?
|
FastTrack Power BI Showcase Dashboards – Strategy – Strategy Financial Analysis |
Power BI Dashboard |
This dashboard shows the forecasted costs of strategic initiatives and programs in select portfolios, allowing you to identify the trend of forecasted costs over time. You can configure the dashboard to slice and display data in numerous ways. |
|
Strategy Portfolio – Portfolio Manager – Customizable Column Set |
Tile |
This allows you to see strategy data in a customizable column set, including roadmaps, financials, effort, and more. |
|
Analytic |
This report analyzes program data and summarized portfolio financial plan data, with effort represented as FTEs, days, and hours, and financials as cost, benefits, and revenue. You can slice data by strategy attributes, account structure levels, or line attributes of selected accounts. The report can be configured to run against each level in the strategy structure. |
|
|
Analytic |
This report compares versions of the strategic program and summarized portfolio financial plan data, with effort represented as FTEs, days, and hours, and financials as cost, benefits, and revenue. A burndown chart is included for the portfolio and each initiative. You can run the report against each level in the strategy structure. |
|
|
Analytic |
This report can select cost, revenue, or benefit-based measures from the financial planning data to drive bubble size and visualize the pipeline of strategic initiatives. You can configure the report to run against each level in the strategy structure. |
|
|
Analytic |
This report allows you to select benefit or revenue measures for the x-axis, a risk-based attribute for the y-axis, and cost-based measures for the bubble size. You can configure the report to run against each level in the strategy structure. |
|
|
Power BI Dashboard |
This dashboard displays a range of out-of-the-box Power BI visualizations for the Financial Summary, Portfolio Balance Count, and Portfolio Balance Cost dashboards. Detailed information for each visualization is provided, highlighting the configuration steps required to recreate the visualization. |
|
|
Work Portfolio – Portfolio Manager – Customizable Column Set |
Screen |
Custom column sets provide an overview of work items in a portfolio and their details, such as synced AgilePlace boards, start and finish dates, and percentage complete. |
|
Analytic |
This report summarizes key project information into a one-page report for stakeholders and project review meetings. The report includes the following:
You can run the report for a single project or across the portfolio. The portfolio report includes an executive summary on the first page, followed by one-page summaries for each project on individual pages. |
|
|
Analytic |
This report analyzes project and portfolio financial plan data, with effort represented as FTEs, days, and hours, and financials as cost, benefits, and revenue. The report uses a single version of the financial plan and a data type based on project attributes, account structure levels, or line attributes of selected accounts. |
|
|
WRK32 – Project/Work Portfolio Financial Burndown Comparison |
Analytic |
This report compares versions of project and work portfolio financial plan data, with effort represented as FTEs, days, and hours, and financials as cost, benefits, and revenue. The report includes the following:
|
|
Analytic |
This report can select cost, revenue, or benefits-based measures from the financial planning data to drive bubble size. |
|
|
Analytic |
This report identifies the risk and reward balance across projects. You can select benefit or revenue measures for the x-axis, a risk-based attribute for the y-axis, and cost-based measures for the bubble size. The report can run against each level in the strategy structure. |
|
|
Outcome Portfolio – Portfolio Manager – Customizable Column Set |
Screen |
Custom column sets can provide overview of the outcome breakdown, including total cost of ownership, labor costs, status assessment, and more. |
|
Analytic |
This report analyzes program data and summarized portfolio financial plan data, with effort represented as FTEs, days, and hours, and financials as cost, benefits, and revenue. The report uses a single version of the financial plan and a data type based on project attributes, account structure levels, or line attributes of selected accounts. You can configure the report to run against each level in the strategy structure. |
|
|
Analytic |
This report compares versions of outcome data and summarized portfolio financial plan data, with effort represented as FTEs, days, and hours, and financials as cost, benefits, and revenue. A burndown chart is included for the portfolio and each initiative. You can configure the report to run against each level in the strategy structure. |
How are we able to understand the impact of financial benefits across time and the impact of changing schedules against our budget?
|
FastTrack Power BI Showcase Dashboards – Work – Financial Summary |
Power BI Dashboard |
This dashboard allows you to compare strategic investments over time. You can view the total costs of a select portfolio over a given timeframe, view the breakdown of those costs by the strategic program, and identify portfolios that are meeting or exceeding approved budgets. Data for investment demand entities can be viewed and managed, allowing you to change their approval status, priority, and above or below-the-line status. |
|
Analytic |
This report compares versions of the strategic program and summarized portfolio financial plan data, with effort represented as FTEs, days, and hours, and financials as cost, benefits, and revenue. A burndown chart is included for the portfolio and each initiative. You can run the report against each level in the strategy structure. |
|
|
Analytic |
This report can select cost, revenue, or benefit-based measures from the financial planning data to drive bubble size and visualize the pipeline of strategic initiatives. You can configure the report to run against each level in the strategy structure. |
|
|
WRK32 – Project/Work Portfolio Financial Burndown Comparison |
Analytic |
This report compares versions of project and work portfolio financial plan data, with effort represented as FTEs, days, and hours, and financials as cost, benefits, and revenue. The report includes the following:
|
|
Analytic |
This report can select cost, revenue, or benefits-based measures from the financial planning data to drive bubble size. |
Best practices
Build a single source of truth
Organizations should strive to standardize their financial processes so that the platform becomes the single source of truth for financial tracking. When everyone is using the same processes and categories, you’ll be able to make accurate decisions and understand the financial status of each project and the entire portfolio.
Fund programs strategically
Prioritize and fund program investments based on quantifiable business benefits, such as ROI, NPV, and customer retention metrics.
Give each value stream a budget
In agile organizations, define spending policies, guidelines, and practices for each value stream within the portfolio. With these guardrails in place, each value stream should have autonomy, flexibility, and the speed to execute their own budget.
Monitor financial health
Having the right reporting and dashboards that display the financial health of both individual projects and the overall portfolio are necessary to ensure the right decisions are made when a project starts to deviate from the plan.
Baseline financial plans
When there is an approved change to a project’s financial plan, save off the new plan as the current baseline. Having each change to the plan saved as a separate baseline allows you to see the progress of financial changes, and when looking back, see adjustments during a project’s initial planning to allow for more accurate budgeting.
Understand top-down and bottom-up
Organizations can use top-down planning (where a pool of funding at the program or strategic level is used to fund the work aligned against it), or bottom-up (where the work is funded and then rolled up to appropriate levels to see the overall costs or benefits). Understanding how your organization tracks and approves funding is important to know what guardrails are in place and what reporting will be used to track financial performance.