
Portfolios process flows
Overview
Value stream funding helps organizations set financial targets for value streams, capture baselines, and monitor variance between planned and actual benefits and revenue. Financial targets provide the context needed to analyze and prioritize agile work, assess capacity for new investments, and drive smarter decision-making. This guide offers a step-by-step approach for establishing and managing value stream funding in Planview Portfolios, covering key financial planning processes, reporting insights, and best practices. By aligning funding to strategic outcomes, maintaining visibility into financial performance, and empowering data-driven decisions, teams can maximize value delivery across the portfolio.
New to value stream funding? Check out this demo video for a quick overview:

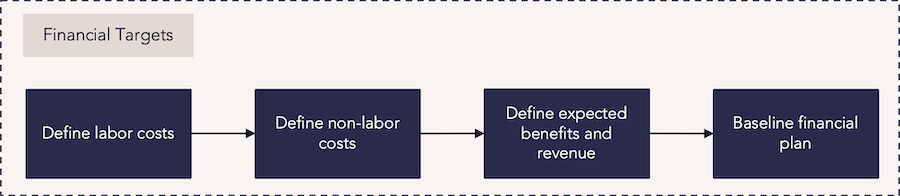
Process steps
| Process step | Description |
|---|---|
| Define labor costs |
Enter the cost targets for labor into the value stream budget. Budgets may be created at any level of the Work or Strategy structure on the Financial Planning Detail screen then spread down to lower levels or rolled up to higher levels. Alternatively, data may be loaded using a financial load then rolled up and edited. For more information: |
| Define non-labor costs |
Enter the non-labor costs into the financial plan. These costs should be divided into the appropriate non-labor categories. Non-labor data is often entered manually, then spread down to lower levels or rolled up to higher levels as part of the larger budgeting process. |
| Define expected benefits and revenue | Enter the revenue targets and benefits for launching the value stream. These targets and benefits can be manually entered into the financial plan. |
| Baseline financial plan |
Following the input or roll-up of financial planning budgeting and target data, a financial baseline should be taken to compare and track variances of the value stream financials across time. |
Reports
How can we define and track the benefits and revenue expectations for the value stream?
|
FastTrack Power BI Showcase Dashboards – Work – Financial Summary |
Power BI Dashboard |
This dashboard allows you to compare strategic investments over time. You can view the total costs of a select portfolio over a given timeframe, view the breakdown of those costs by the strategic program, and identify portfolios that are meeting or exceeding approved budgets. Data for investment demand entities can be viewed and managed, allowing you to change their approval status, priority, and above or below-the-line status. |
|
Analytic |
This report compares versions of the strategic program and summarized portfolio financial plan data, with effort represented as FTEs, days, and hours, and financials as cost, benefits, and revenue. A burndown chart is included for the portfolio and each initiative. You can run the report against each level in the strategy structure. |
|
|
Analytic |
This report can select cost, revenue, or benefit-based measures from the financial planning data to drive bubble size and visualize the pipeline of strategic initiatives. You can configure the report to run against each level in the strategy structure. |
|
|
WRK32 – Project/Work Portfolio Financial Burndown Comparison |
Analytic |
This report compares versions of project and work portfolio financial plan data, with effort represented as FTEs, days, and hours, and financials as cost, benefits, and revenue. The report includes the following:
|
|
Analytic |
This report can select cost, revenue, or benefits-based measures from the financial planning data to drive bubble size. |
|
|
Tile |
In the Planning Portfolio – Investment and Capacity Planning View, use the Planning Manager Tile to view investments and make decisions based on portfolio financial targets and capacity targets. Use the Analyze Pivot View to analyze investments by moving them above (accepted investments) and below the line (pipeline investments). |
|
|
PowerBI Dashboard |
For organizations using a connected Planview Portfolios-Planview AgilePlace environment to manage work in a full value stream, these PowerBI reports visualize work and strategy information for value stream and epic analysis. The Value Stream Analysis – Work and Strategies dashboard includes metrics from both work and strategies in Planview Portfolios, and boards, cards, and tasks in Planview AgilePlace. |
Best practices
Create guardrails for spending
Once you align your budget with your outcomes, create guardrails that define spending policies, guidelines, capacity, and practices across the portfolio. This ensures that the right investments are made within each budget while giving teams the freedom to weigh new opportunities against long-term strategies.
Allocate funding strategically
Organizations must ensure the right investments are made within each budget. They must set politics aside, review business cases objectively, ascertain their potential business impact, and fund the top value streams incrementally to reduce financial risk.
Reassess budgets often
Reassess your budget regularly to analyze investments across value streams and reallocate funds to new initiatives. Continuously monitoring your portfolio enables you to pivot toward new opportunities or away from unsatisfactory projects with greater flexibility and ease.
Budget collaboratively
Create a better-informed and effective system for distributing investments by involving stakeholders and business owners in the budgeting process. Participatory budgeting encourages leaders to share resources to achieve results within their initiative.
Use scenario planning
Scenario planning helps to forecast the cost and benefits of a given selection of product investments. Create and assess various scenarios of different product mixes to ensure the products you choose to invest in can achieve your organization’s strategic goals. For more information, see Prioritization and Scenario Analysis.