
Portfolios process flows
Overview
This guide provides an in-depth walkthrough of how organizations can leverage the organizational funding capability in Planview Portfolios to manage investment planning and ensure financial alignment across strategic initiatives. Learn how to define labor and non-labor cost targets, enter expected benefits and revenue, and baseline your financial plan to track variances over time. You’ll also explore how to adjust financial plans as priorities shift, and use reporting tools to assess the impact of changing demand on your funding targets. Whether you're planning for new investments or tracking existing ones, this guide outlines the tools, processes, and best practices to help you keep your financial plans on track and aligned with organizational strategy.
New to organizational funding? Watch this demo video for a quick overview:

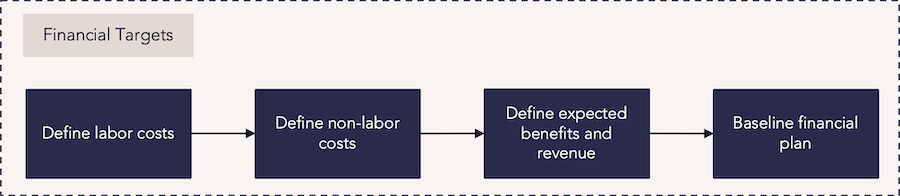
Process steps
| Process step | Description |
|---|---|
| Define labor costs |
Enter the cost targets for labor into the financial plan. These targets can then be balanced against demand. For this capability, the costs for labor capacity are derived from the cost center or providing organization. Labor capacity can be entered manually or loaded from resource availability and planned standard activities. For investment and capacity planning, data may be loaded using a capacity or demand financial load and then rolled up and edited. For more information: |
| Define non-labor costs |
Enter the cost targets for non-labor financial costs into the financial plan. These targets should be divided into the appropriate non-labor categories. Non-labor data is often entered manually, then spread down to lower levels or rolled up to higher levels as part of the larger budgeting process. |
| Define expected benefits and revenue | Enter the revenue targets and benefits into the financial plan. These targets and benefits can be entered manually by drilling into the individual cost center financial plans. |
| Baseline financial plan | Following the input or roll-up of financial planning target data, a financial baseline should be taken to compare and track variances of the financials across time. |
Reports
How are we able to see our financial targets for benefits and costs?
| FastTrack Power BI Showcase Dashboards – Work – Portfolio Balance Cost | Power BI Dashboard | This dashboard shows how project investment costs are balanced across strategic initiatives in a portfolio. You can view a portfolio’s total spending for each month, actual spending to date by department, and additional financial information broken down by project. |
| FastTrack Power BI Showcase Dashboards – Work – Financial Summary | Power BI Dashboard | This dashboard allows you to compare strategic investments over time. You can view the total costs of a select portfolio over a given timeframe, view the breakdown of those costs by the strategic program, and identify portfolios that are meeting or exceeding approved budgets. Data for investment demand entities can be viewed and managed, allowing you to change their approval status, priority, and above or below-the-line status. |
| WRK31 – Work Portfolio Financial Analysis | Analytic |
This report analyzes project and portfolio financial plan data, with effort represented as FTEs, days, and hours, and financials as cost, benefits, and revenue. |
| WRK33 – Project Cost or Revenue/Benefit Bubble | Analytic | This report can select cost, revenue, or benefits-based measures from the financial planning data to drive bubble size. |
| WRK34 – Work Portfolio Investment Balance Bubble | Analytic | This report identifies the risk and reward balance across projects. You can select benefit or revenue measures for the x-axis, a risk-based attribute for the y-axis, and cost-based measures for the bubble size. The report can run against each level in the strategy structure. |
| Planning Portfolio – Planning Manager – Analyze Pivot View | Tile |
In the Planning Portfolio – Investment and Capacity Planning View, use the Planning Manager Tile to view investments and make decisions based on portfolio financial targets and capacity targets. Use the Analyze Pivot View to analyze investments by moving them above (accepted investments) and below the line (pipeline investments). |
How are we able to understand how changing demand impacts our financial targets?
| FastTrack Power BI Showcase Dashboards – Work – Financial Summary | Power BI Dashboard | This dashboard allows you to compare strategic investments over time. You can view the total costs of a select portfolio over a given timeframe, view the breakdown of those costs by the strategic program, and identify portfolios that are meeting or exceeding approved budgets. Data for investment demand entities can be viewed and managed, allowing you to change their approval status, priority, and above or below-the-line status. |
| Work Portfolio – Portfolio Manager – Financial Variance Column Set | Tile | The Work Portfolio – Portfolio Manager – Financial Variance Column Set gives you an overview of the work items in a portfolio. This allows you to see negative and positive variances in costs and effort, along with access to the details of each work item. |
| WRK32 – Project/Work Portfolio Financial Burndown Comparison | Analytic |
This report compares versions of project and work portfolio financial plan data, with effort represented as FTEs, days, and hours, and financials as cost, benefits, and revenue. The report includes the following:
|
| Planning Portfolio – Planning Manager – Analyze Pivot View | Tile |
In the Planning Portfolio – Investment and Capacity Planning View, use the Planning Manager Tile to view investments and make decisions based on portfolio financial targets and capacity targets. Use the Analyze Pivot View to analyze investments by moving them above (accepted investments) and below the line (pipeline investments). |
| Planning Portfolio – Planning Manager – Shift and Balance Pivot Views | Tile |
In the Planning Portfolio – Investment and Capacity Planning View, use the Planning Manager Tile to view current and pipeline investments and make decisions based on portfolio financial targets and capacity targets. Use the Shift Pivot View to assess which investments are at risk due to insufficient capacity and examine the impact of shifting investment dates and durations. Use the Balance Pivot View to identify and resolve capacity and demand issues in order to continue with priority investments. |
Best practices
Inform stakeholders
The organizational budget is the engine that balances potential projects waiting for funding with the organization’s current in-flight work against the total capacity for work. It communicates to stakeholders how much money is available and when it’s available, allowing for informed decisions on the project portfolio, such as when projects can be started, paused, or cut to ensure the right priorities are being funded and delivered.
Use historical data
Your organization or departments likely have data from trying to accomplish similar objectives or goals in the past. Use this to your advantage as you move forward with the current strategy. Looking back at similar time periods – the projects funded and their forecast to actual budgets – is a great way to get a head start on building your overall financial plan.
Baseline and re-baseline
Your organizational budget is the baseline by which you’ll measure progress and make updates as the underlying projects progress. It’s a tool to gauge the variance of the plan. If the situation changes and the overall budget is adjusted, you’ll want to keep the appropriate baselines to see the evolution of the budget and how it’s performing against the current actuals.
Keep resource rates accurate
Resource rates can change, and when that happens it can significantly impact a project’s budget. Understanding when resource rates are adjusted, how that’s communicated to project managers, and assessing the impacts to all budgets is imperative to keeping a handle on the overall portfolio budget.
Budget and track non-labor costs
Budgets are comprised of both labor and non-labor costs (such as hardware, software, or professional services). Having specific categories set up for tracking non-labor costs and accurately detailing them as part of the budget – as well as when actuals come in – will allow for accurate planning of all project costs.