
Portfolios process flows
Overview
The strategic and program funding capability helps organizations manage their strategic planning and investment decisions by setting time-phased financial targets at both the strategic and program levels. This capability enables the creation of a strategic budget by entering labor capacity and non-labor financial targets, with the option to baseline the financial plan for variance reporting. It supports the analysis of budgets against demand, helping organizations assess their ability to take on new investments.
This guide offers a comprehensive approach for defining labor and non-labor costs, entering expected benefits and revenue targets, and baselining financial plans. It covers key processes, reporting tools, and best practices to help organizations optimize their financial management, monitor progress, and make informed decisions regarding their strategic investments.
New to strategic and program funding? Watch this demo video for a quick overview:
Process flows
| Process step | Description |
|---|---|
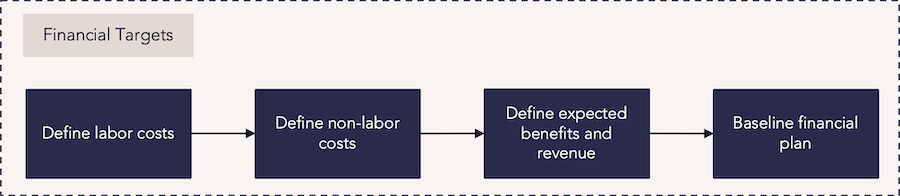
| Define labor costs |
Enter the cost targets for labor into the strategic financial plan. For this capability, the costs for labor capacity represent the investment “pot” of money that will be used to balance against the many demand priorities an organization is considering. Budgets may be created at any level of the Strategy structure on the Financial Planning Detail screen then spread down to lower levels or rolled up to higher levels. Alternatively, data may be loaded using a strategic financial load, then rolled up and edited. For more information: |
| Define non-labor costs |
Enter the non-labor costs into the strategic budget. These costs should be divided into the appropriate non-labor categories. Non-labor data is often entered manually, then spread down to lower levels or rolled up to higher levels as part of the larger budgeting process. |
| Define expected benefits and revenue | Enter the revenue targets and benefits for the strategic investment. These targets and benefits can be manually entered into the strategic financial plan. |
| Baseline financial plan | Following the input or roll-up of financial planning target data, a financial baseline should be taken to compare and track variances of the financials across time. |
Reports
How are we able to see our financial targets for benefits and costs?
|
FastTrack Power BI Showcase Dashboards – Work – Financial Summary |
Power BI Dashboard | This dashboard allows you to compare strategic investments over time. You can view the total costs of a select portfolio over a given timeframe, view the breakdown of those costs by the strategic program, and identify portfolios that are meeting or exceeding approved budgets. Data for investment demand entities can be viewed and managed, allowing you to change their approval status, priority, and above or below-the-line status. |
|
FastTrack Power BI Showcase Dashboards – Work – Portfolio Balance Cost |
Power BI Dashboard |
This dashboard shows how project investment costs are balanced across strategic initiatives in a portfolio. You can view a portfolio’s total spending for each month, actual spending to date by department, and additional financial information broken down by project. |
| FastTrack Power BI Showcase Dashboards – Strategy – Strategy Financial Analysis | Power BI Dashboard | This dashboard shows the forecasted costs of strategic initiatives and programs in select portfolios, allowing you to identify the trend of forecasted costs over time. You can configure the dashboard to slice and display data in numerous ways. |
| Analytic | This report can select cost, revenue, or benefit-based measures from the financial planning data to drive bubble size and visualize the pipeline of strategic initiatives. You can configure the report to run against each level in the strategy structure. | |
| Analytic |
This report allows you to select benefit or revenue measures for the x-axis, a risk-based attribute for the y-axis, and cost-based measures for the bubble size. You can configure the report to run against each level in the strategy structure. |
|
| Planning Portfolio – Planning Manager – Analyze Pivot View | Tile |
In the Planning Portfolio – Investment and Capacity Planning View, use the Planning Manager Tile to view investments and make decisions based on portfolio financial targets and capacity targets. Use the Analyze Pivot View to analyze investments by moving them above (accepted investments) and below the line (pipeline investments). |
How are we able to understand how changing demand impacts our financial targets?
| FastTrack Power BI Showcase Dashboards – Strategy – Strategy Financial Analysis | Power BI Dashboard | This dashboard shows the forecasted costs of strategic initiatives and programs in select portfolios, allowing you to identify the trend of forecasted costs over time. You can configure the dashboard to slice and display data in numerous ways. |
|
Strategy Portfolio – Portfolio Manager – Financial Variance Column Set |
Tile | This customizable column set allows you to compare two financial models and identify cost variances between them. |
| Analytic |
This report compares versions of the strategic program and summarized portfolio financial plan data, with effort represented as FTEs, days, and hours, and financials as cost, benefits, and revenue. A burndown chart is included for the portfolio and each initiative. You can run the report against each level in the strategy structure. |
|
| Planning Portfolio – Planning Manager – Analyze Pivot View | Tile |
In the Planning Portfolio – Investment and Capacity Planning View, use the Planning Manager Tile to view investments and make decisions based on portfolio financial targets and capacity targets. Use the Analyze Pivot View to analyze investments by moving them above (accepted investments) and below the line (pipeline investments). |
| Planning Portfolio – Planning Manager – Shift and Balance Pivot Views | Tile |
In the Planning Portfolio – Investment and Capacity Planning View, use the Planning Manager Tile to view current and pipeline investments and make decisions based on portfolio financial targets and capacity targets. Use the Shift Pivot View to assess which investments are at risk due to insufficient capacity and examine the impact of shifting investment dates and durations. Use the Balance Pivot View to identify and resolve capacity and demand issues in order to continue with priority investments. |
Best practices
Embrace adaptive funding
Capture changes over time to assess and manage funding changes at both the investment and portfolio level. Fund portfolios incrementally based on timeframe or stage-gate to evaluate investment progress and make course corrections easier.
Manage strategic funding and performance
The right strategic plan enables you to maximize the ROI from strategic initiatives. An investment-centric approach creates capital plans that integrate strategic and organizational financials to promote visibility and drive performance. Executives and others should be able to prioritize and rank investments based on their alignment with corporate strategies and financials.
Reallocate funding
A shift in strategy prompts an analysis of portfolio funding. Knowing the current spending on each strategic initiative provides a baseline for determining changes to support the new direction. Teams can determine new funding levels for each portfolio based on the updated strategy. This strategic management process encourages finance to create more flexible funding approaches to easily reallocate as circumstances require.
Capture benefits
Capture the benefits of strategic programs by how they add value and contribute to the strategic objectives of the organization. Track benefits over time and automatically calculate financial metrics such as IRR, NPV, ROI, and Payback Period, using dashboards to understand the performance measurement across the portfolio in an easy, visual way.
Plan at all levels
Support business plans at different levels – strategy, objectives, initiatives – with each having their own budgets, desired results, owners, and other key information to outline the plan. Identify both financial and non-financial benefits to be achieved to create value.
Build a business case
Enable stakeholders to build a strategic business case with capital and operating expense plans to achieve objectives, understand how funding is being spent, and reallocate as needed throughout the fiscal period.