
Portfolios process flows
Overview
This guide provides an in-depth overview of how the product portfolio and pipeline planning capability enables organizations to efficiently manage their product pipeline, from initial business request intake to product delivery. Learn how to create and categorize new product requests, input relevant financial data, and apply a structured intake process that ensures accurate review and approval at each decision stage. Discover how to align products with strategic objectives, plan and manage associated projects and programs, and continuously track financial performance. This guide covers the tools, processes, and best practices needed to effectively plan, prioritize, and execute your product portfolio initiatives in Planview Portfolios.
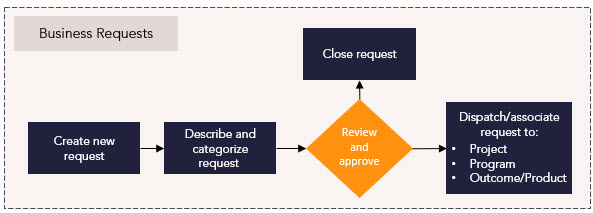
Business requests
Process steps
| Process step | Description |
|---|---|
| Create new request |
Create new request entities, or ideas for potential work that are entered into Planview Portfolios.
|
| Describe and categorize request |
During the initiation of a request, information is populated to describe and categorize the request. Often a minimum level of required categorization or descriptive information is enforced during the request creation lifecycle based on the information needs of the organization. |
| Review and approve |
Once you have a request portfolio, you can see detailed information regarding the requests that are included in your portfolio on the Portfolio Manager tile within the Request Portfolio View screen. This will allow the request to be reviewed in preparation for dispatch. For more information: |
|
Dispatch/associate request to project, program, or outcome/product |
The purpose of this step is to connect the request with a relevant entity in Planview Portfolios. This can be achieved by either dispatching the request which generates a new entity or associating it with an already existing one.
For more information: |
| Close request |
If approval is not granted or the request is no longer needed, change the status to closed. This provides a record of its status for reporting and ensures that no further updates can be made to the request. Depending on the internal business process, the process to close the request can vary and may contain approval gates in a lifecycle workflow. In these instances, successful completion of the lifecycle steps by the relevant users will automatically close the Request. The status of the request can be changed in the Request Detail screen, or directly in the Portfolio Manager using an appropriate column set selection. For more information: |
Reports
How are we able to see requests and their details?
|
Requests Portfolio – Portfolio Manager – Customizable Column Set |
Tile |
This tile allows you to see request data in a customizable column set with data such as start date, status, and more. |
|
Requests Portfolio – Active Requests |
Tile |
This tile shows you active requests in the portfolio. |
|
Requests Portfolio – New Requests |
Tile |
This tile shows you new requests in the portfolio. |
|
Requests Portfolio – Pending Requests |
Tile |
This tile shows you pending requests in the portfolio. |
|
Analytic |
This report allows you to analyze work requests by category, originating business unit, or any configured single select work request structures. |
|
|
Analytic |
This report provides a count of request attributes to help you analyze the portfolio. The report allows you to choose which attributes are used to slice the data. |
How are we able to understand the approval status of requests?
|
Requests Portfolio – Active Requests |
Tile |
This tile shows you active requests in the portfolio. |
|
Requests Portfolio – Dispatched Requests |
Tile |
This tile shows you dispatched requests in the portfolio. |
|
Requests Portfolio – Closed Requests |
Tile |
This tile shows closed requests in the portfolio. |
|
Analytic |
This report allows you to analyze the speed of requests through the intake process, from the creation of a work request to dispatch into a new project or program. It can be analyzed by business unit or any configured single-select work request structures. |
|
|
Analytic |
This report shows the status of work requests. You can adjust the parameters to slice the data by category, status, and time horizon. |
|
|
Analytic |
This report analyzes changes in request status to aid analysis of throughput, volume, and cycle time. Further analysis, based on request attributes such as work type or customer, is also supported. |
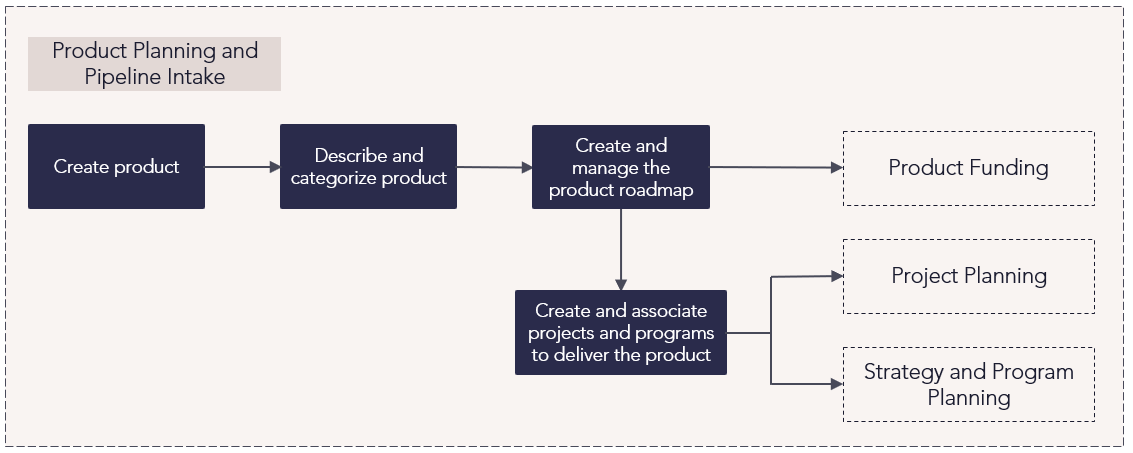
Product planning and pipeline intake
Process steps
| Process step | Description |
|---|---|
| Create product |
Create a record of the new product entity in Planview Portfolios. For more information: |
| Describe and categorize product | After a new product is created, create configuration-specific description and categorization attributes as determined by the organization's data and information needs. |
| Create and manage product roadmap |
Define the target dates and milestones of the product. This allows the product manager to align the product schedule and the schedule of the associated entities that will deliver the product. For more information: |
| Create and associate projects and programs to deliver the product |
Projects and programs provide a way of planning and managing the pipeline of work with the related schedule and resources required to deliver the product. Following creation of the product, the pipeline of projects and programs required to deliver can be planned and scoped. The product manager will work with the relevant project manager/s to achieve this. Creating a project or program directly against the product automatically creates the association with the product. Creating a project or program separately requires a manual association to the product after the entity has been created. When a project or program is associated to product, an allocation percentage is defined. This allocation percentage is used to roll up the project's and program's cost to its associated product. For more information see the following articles: |
Reports
How are we able to review the details of a portfolio of products compared to each other?
|
Outcome Portfolio – Portfolio Manager – Customizable Column Set |
Tile |
This customizable column set allows you to see an overview of the outcome breakdown, including total cost of ownership, labor costs, status assessment, and more. |
|
Analytic |
This report summarizes key data points relating to the products in your product hierarchy so you can understand your product portfolio's health. Configure the report to show each product’s specific attributes, fields, dates, and financial plan measures. |
|
|
Analytic |
This report provides a count of the outcomes in a portfolio based on selected attributes, allowing you to identify imbalanced portfolios and adjust based on organizational priorities. |
|
|
Analytic |
This dashboard provides a count of products to help you analyze the portfolio. The report allows you to choose which attributes are used to slice the data. |
How are we able to review the details of outcomes compared to each other within a portfolio of products?
|
Outcome Portfolio – Portfolio Manager – Roadmap Column Set |
Tile |
In the Outcome Portfolio – Portfolio Manager Tile, toggle the Roadmap Column Set to display the current and baseline roadmap schedule, stages, and milestones. |
|
Analytic |
This report summarizes key data points relating to the products in your product hierarchy so you can understand your product portfolio's health. Configure the report to show each product’s specific attributes, fields, dates, and financial plan measures. |
|
|
Analytic |
This report can select cost, revenue, or benefits-based measures from the financial planning data to drive bubble size and visualize the product pipeline. You can configure the report to run against each level in the outcome structure. |
How are we able to review product financials?
|
Outcome Portfolio – Portfolio Manager – Financial Variance Column Set |
Tile |
This column set allows you to compare financial variances between an outcome's forecasted and actual costs. |
|
Analytic |
This report analyzes product financial plan data, representing effort as FTEs, days, and hours, and financials as cost, benefits, and revenue. The report uses a single version of the financial plan and a data type based on attributes, account structure levels, or line attributes of selected accounts. |
|
|
Analytic |
This report compares versions of product data and summarized portfolio financial plan data, with effort represented as FTEs, days, and hours, and financials as cost, benefits, and revenue. A burndown chart is included for the portfolio and each initiative. You can configure the report to run against each level in the outcome structure. |
How are we able to view changes, risks, and issues associated with products?
|
Analytic |
This report summarizes change requests for a portfolio of products. You can classify change requests by two parameterized attributes, drill down into data, and slice the list of change requests. |
|
|
Analytic |
This report provides a risk registry summary for a portfolio of products. Use this matrix to classify risks by two parameterized attributes, drill down into data, and slice the list of risks. |
|
|
Analytic |
This report provides an issue log summary for a portfolio of products. Use this matrix to classify issues by two parameterized attributes, drill down into data, and slice the list of change requests. |
How are we able to understand products and investments across our organization? How are we able to understand their status?
|
Outcome Portfolio – Portfolio Manager – Customizable Column Set |
Tile |
This customizable column set allows you to see an overview of the outcome breakdown, including total cost of ownership, labor costs, status assessment, and more. |
|
Analytic |
This bubble chart provides a value versus cost visualization of the portfolio pipeline by plotting prioritization, effort, cost, benefit, and revenue measures against product status dimensions such as lifecycle stage and strategic alignment. Use this data to identify underperforming or overperforming products and shift resources and spending accordingly. |
|
|
Analytic |
This report compares versions of product data and summarized portfolio financial plan data, with effort represented as FTEs, days, and hours, and financials as cost, benefits, and revenue. A burndown chart is included for the portfolio and each initiative. You can configure the report to run against each level in the outcome structure. |
|
|
Analytic |
This report analyzes the risk and reward balance across the product portfolio. You can select revenue measures for the x-axis, risk-based attributes for the y-axis, and cost-based measures for the bubble size. |
|
|
Analytic |
This report leverages data on the product approval process to analyze performance in terms of throughput, volume, and cycle time. You can run the report and slice data against different attributes, such as product type and process stage. |
|
|
Analytic |
This analytic summarizes data in an investment planning portfolio scenario by providing a time-phased view of the portfolio demand and targets. Portfolio demand is compared to the capacity of resources or funds required to deliver the portfolio, or to the benefits/revenue the portfolio must deliver. This analytic supports project, strategy, and product-based portfolios. |
|
|
Analytic |
This planning portfolio report creates a time-phased financial burndown chart of the whole planning portfolio or each individual project, allowing you to track actual burn and forecast burn to ensure that spend, effort, revenue, or benefits are in line with projections. This report compares versions of the financial plan with effort represented as FTEs, days, or hours, and financials as cost, benefits, or revenue. |
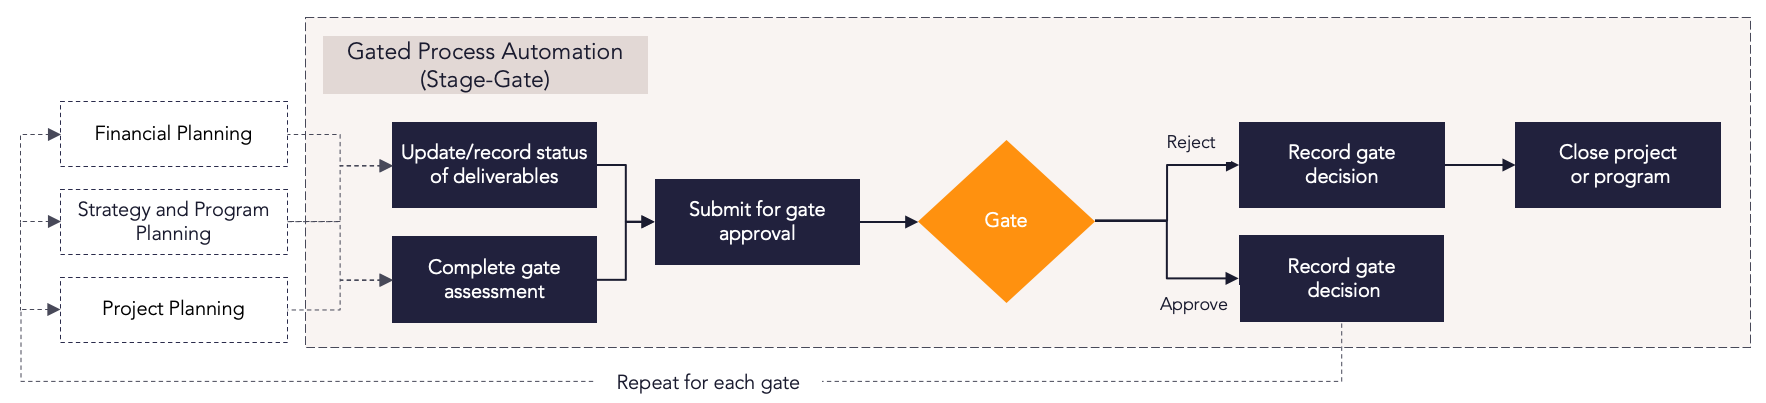
Gated process automation
Process steps
| Process step | Description |
|---|---|
|
Update/record status of deliverables |
Prior to going through a gate, project or program managers should ensure that the status of all relevant deliverables are updated. |
|
Complete gate assessment |
Project or program managers complete the gate assessment form – this is often in the form of a configured screen, and includes the population of checklist items and fields related to the specific gate. |
|
Submit for gate approval |
The project or program manager submits the gate assessment for approval. |
|
Gate |
This step represents the gate decision point. Gate approvers review the gate assessment and status information then decide on whether to proceed with the project/program. |
|
Record gate decision (approve) |
If the gate request is approved, the decision is recorded and the project or program proceeds to the next stage. |
|
Record gate decision (reject) |
If the gate request is rejected, the decision and reason is recorded, then the project/program returns to the original gate for update/resubmission or moves into the closure process. |
|
Close project/program |
Change the project or program status to completed. |
Reports
How are we able to view how our products align to governing standards?
|
Outcome Portfolio – Portfolio Manager – Customizable Column Set |
Tile |
This customizable column set allows you to see an overview of the outcome breakdown, including total cost of ownership, labor costs, status assessment, and more. |
|
Tile |
This tile gives an overview of lifecycle steps for entities in the outcome portfolio such as the user responsible, date, and accepted or rejected steps. |
|
|
Analytic |
This report tracks performance data for the product lifecycle in terms of throughput, volume, and cycle time. You can slice the report with product attributes such as product type or customer. |
|
|
Analytic |
This report tracks performance data for the product development lifecycle in terms of throughput, volume, and cycle time. |
How are we able to view the current state of products in the stage gate and approval process?
|
Outcome Portfolio – Portfolio Manager – Roadmap Column Set |
Tile |
In the Outcome Portfolio – Portfolio Manager Tile, toggle the Roadmap Column Set to display the current and baseline roadmap schedule, stages, and milestones. |
|
Tile |
This tile gives an overview of lifecycle steps for entities in the outcome portfolio such as the user responsible, date, and accepted or rejected steps. |
|
|
Analytic |
This report tracks performance data for the product lifecycle in terms of throughput, volume, and cycle time. You can slice the report with product attributes such as product type or customer. |
|
|
Analytic |
This report tracks performance data for the product development lifecycle in terms of throughput, volume, and cycle time. |
Best practices
Work from a central intake
Aggregate work for evaluation and prioritization by determining your work intake process. Centralized intake enables you to prioritize and plan a portfolio based on capacity. Route requests through the system and re-prioritize frequently.
Direct the work intake process
Let the process do the heavy lifting by using gates to organize the flow, collection, and evaluation of information. Match approval gates to decision points and streamline the process by deferring or placing low-value requests on hold, and advancing high-value requests quickly.
Access to data is key
Timely and accurate data across the organization is crucial for driving strategic innovation decisions.
Always consider scope
Set high-level estimates for effort, time, and resources required to complete a business request. Keeping scope in mind throughout the planning process leads to greater success.
Simplify the request process
Provide a simple, standardized form for requests, ensuring everyone has access to it. This helps prevent intake overload and makes it easier to manage requests during evaluation.
Standardize request evaluations
Create an objective, concise set of criteria for prioritizing requests, making the evaluation process more efficient and reducing tension around requests that aren't approved.
Continuously improve the request process
Focus on continuous improvement to achieve sustainable success. Measure, evolve, and adapt your processes to meet organizational needs, and use repeatable processes for making trade-off decisions and identifying potential roadblocks.
Optimize your review process
Have a clear process in place for evaluating requests—approve, deny, or send them to the backlog. Designate one person to oversee this process for clarity and efficiency.
Categorize requests
Assess and categorize demand based on organizational benefit. Use scoring models to evaluate requests on both quantitative and qualitative factors like ROI, strategic fit, impact, or risk.