
Portfolios process flows
Overview
This guide provides a comprehensive walkthrough of how organizations can use Planview Portfolios to manage project and program costs with accuracy and control. Learn how to capture labor and non-labor costs, compare actuals to budgets, and use forecast data to make informed financial decisions. Whether you're tracking project spend, analyzing variances, or managing exceptions, you’ll find the tools, processes, and best practices needed to support effective cost oversight.
New to cost management? Watch the demo video for a quick overview of how you can gain financial visibility and stay on budget across your portfolio:

Process steps
| Process step | Description |
|---|---|
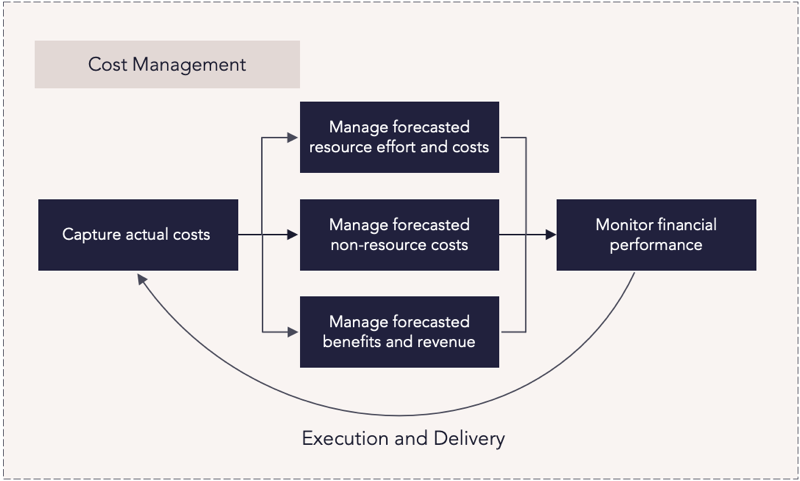
| Capture actual costs |
Update the financial plan with the actual costs incurred in a historical time period to capture an accurate representation of the expenditures. This information can be used as a comparison against the budget or previous baselines to track variances against the estimated spend. Costs can be loaded from the plan, rolled up, or captured directly on the financial plan. Costs may include:
|
| Manage forecasted resource effort and costs | Ensure the financial plan accurately reflects the estimated resource costs and effort required. This up-to-date cost and effort information helps managers understand the impact of the pending resource costs on the portfolio. Make sure that resource demand and assignments information is current to ensure that the financial plan accurately represents the forecasted costs. |
| Manage forecasted non-resource costs | Ensure the financial plan accurately reflects the estimated non-resource costs. This helps provide an accurate forecast of the predicted expenditure. |
|
Manage forecasted benefits and revenue |
Ensure the financial plan accurately reflects the estimated benefits to provide an accurate forecast of the predicted revenue. Update the benefit costs which were previously populated in the original estimation or previous rounds of reforecasting directly into the financial plan to reflect the latest and most accurate forecast. These amounts should continue to be associated with the appropriate benefit sub-account information depending on your configuration to help categorize the revenue and allow portfolio-level summarization of the types of benefits. |
| Monitor financial performance |
Track the current performance of the financials against the original budget and use this information to make informed decisions and manage exceptions. Managers can use financial versions to compare different financial versions over time. For example, to monitor the financial performance against the original budget and earlier snapshots, the current actual and forecast data in the financial plan can be compared against previous baseline versions. |
Reports
How are we able to see where we are currently forecast to not meet our approved budgets (under or over)?
|
FastTrack Power BI Showcase Dashboards – Strategy – Strategy Financial Analysis |
Power BI Dashboard |
This dashboard shows the forecasted costs of strategic initiatives and programs in select portfolios, allowing you to identify the trend of forecasted costs over time. You can configure the dashboard to slice and display data in numerous ways. |
|
Strategy Portfolio – Portfolio Manager – Customizable Column Set |
Tile |
This allows you to see strategy data in a customizable column set, including roadmaps, financials, effort, and more. |
|
Analytic |
This one-page report provides an executive summary of key program information for program stakeholders followed by detailed reports, including:
This report can be run for a single program or a portfolio. |
|
|
Analytic |
This report compares versions of the strategic program and summarized portfolio financial plan data, with effort represented as FTEs, days, and hours, and financials as cost, benefits, and revenue. A burndown chart is included for the portfolio and each initiative. You can run the report against each level in the strategy structure. |
|
|
Work Portfolio – Portfolio Manager – Customizable Column Set |
Tile |
This column set gives you an overview of work items in a portfolio and their details, including synced AgilePlace boards, start and finish dates, and percentage complete. |
|
Work Portfolio – Work Over Budget |
Tile |
This tile lists all projects where the forecasted costs are greater than the baseline costs. |
|
Analytic |
This report summarizes key project information into a one-page report for stakeholders and project review meetings. The report includes the following:
You can run the report for a single project or across the portfolio. The portfolio report includes an executive summary on the first page, followed by one-page summaries for each project on individual pages. |
|
|
WRK32 – Project/Work Portfolio Financial Burndown Comparison |
Analytic |
This report compares versions of project and work portfolio financial plan data, with effort represented as FTEs, days, and hours, and financials as cost, benefits, and revenue. The report includes the following:
|
|
Tile |
In the Planning Portfolio – Investment and Capacity Planning View, use the Planning Manager Tile to view investments and make decisions based on portfolio financial targets and capacity targets. Use the Analyze Pivot View to analyze investments by moving them above (accepted investments) and below the line (pipeline investments). |
How are we able to see actual costs to date, forecast to complete, and total cost at completion?
|
Work Portfolio – Portfolio Manager – Customizable Column Set |
Tile |
This column set gives you an overview of work items in a portfolio and their details, including synced AgilePlace boards, start and finish dates, and percentage complete. |
|
Analytic |
This report summarizes key project information into a one-page report for stakeholders and project review meetings. The report includes the following:
You can run the report for a single project or across the portfolio. The portfolio report includes an executive summary on the first page, followed by one-page summaries for each project on individual pages. |
How are we able to understand the impact of financial benefits across time and the impact of changing schedules against our budget?
|
FastTrack Power BI Showcase Dashboards – Work – Financial Summary |
Power BI Dashboard |
This dashboard allows you to compare strategic investments over time. You can view the total costs of a select portfolio over a given timeframe, view the breakdown of those costs by the strategic program, and identify portfolios that are meeting or exceeding approved budgets. Data for investment demand entities can be viewed and managed, allowing you to change their approval status, priority, and above or below-the-line status. |
|
Analytic |
This report compares versions of the strategic program and summarized portfolio financial plan data, with effort represented as FTEs, days, and hours, and financials as cost, benefits, and revenue. A burndown chart is included for the portfolio and each initiative. You can run the report against each level in the strategy structure. |
|
|
Analytic |
This report can select cost, revenue, or benefit-based measures from the financial planning data to drive bubble size and visualize the pipeline of strategic initiatives. You can configure the report to run against each level in the strategy structure. |
|
|
WRK32 – Project/Work Portfolio Financial Burndown Comparison |
Analytic |
This report compares versions of project and work portfolio financial plan data, with effort represented as FTEs, days, and hours, and financials as cost, benefits, and revenue. The report includes the following:
|
|
Analytic |
This report can select cost, revenue, or benefits-based measures from the financial planning data to drive bubble size. |
Best practices
Build a single source of truth
Organizations should strive to standardize their financial processes so that the platform becomes the single source of truth for tracking all costs and benefits. When everyone is using the same processes and categories to define costs and benefits, you’ll be able to make accurate decisions and understand the financial status of each project and the entire portfolio.
Maintain accurate data
Financial plans need to be accurate so appropriate decisions can be made. This includes the original project budget and the ongoing tracking of actuals against the budget. For actual costs and benefits that are not automatically loaded, managers should ensure they are updating the financial plan in a timely fashion and with the most current information to enable accurate analysis of how projects are performing to plan.
Establish clear cost controls in planning
Cost control is established to ensure investments stay on track, do not experience cost-overrun, and maximize revenue and benefits. During planning investments should have accurately defined fixed versus variable costs, cost of labor and materials and the expected ROI. Within execution variance tracking of actual costs to plan, having change control established, and any other cost controls in place will allow for easily identifying areas of overspend to which strategic decisions can then be made on the investment portfolio.
Accurately track labor costs
Labor costs are one of the highest expenses organizations contend with. Organizations can ensure their labor costs are accurate by: defining resources as employee or contractors; having specific rates set up by resource type, role or named individual which are time-boxed; allowing for rate overrides to be set when needed; and correctly tracking added cost for overtime.
Understand contractor and employee ratio and costs
Organizations should periodically review the ratio of contractors to employees and the related cost to maintain the "happy balance" of labor cost savings and peak functionality.