Planview Customer Success Center

Program Management

Program Management

The Program Management capability supports the management of program roadmap realization. Each capability within the Planview Capability Framework has a distinct set of features and functionality, business processes, best practices, and analytics and reports that deliver value to customers in the form of specific business outcomes.

Processes and Reports

conceptual image_program management.jpg 

The program management capability allows you to monitor and manage the overall progress of your program through its underlying projects. This capability supports the creation, planning, business case development and approval of programs that enable organizations to achieve long-term strategic initiatives and business goals.


Video: Program Management Demo


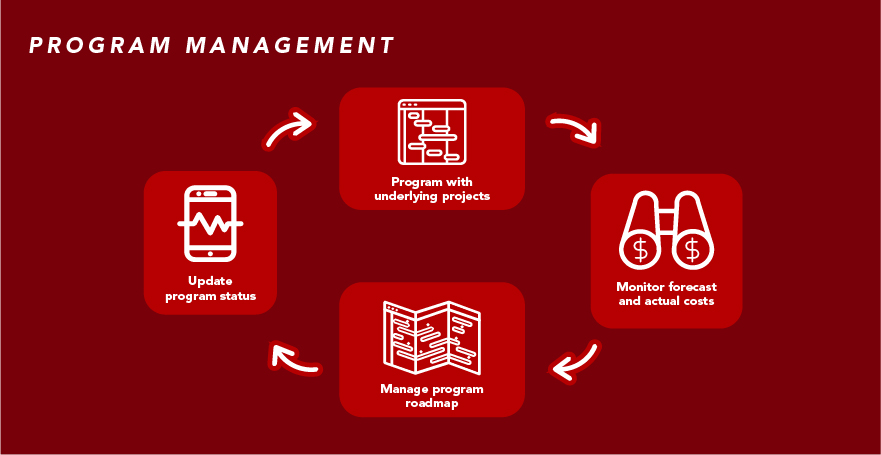
Program Management Process Steps


Program Management Process flow 1200.jpg

Program management process flow


Process Step Description
Do work     Resources carry out the work that has been assigned to them.
Deliver program through underlying projects Relevant project managers monitor and manage all captured information on project status and progress as resources execute projects and deliver work. This information can also be consolidated and visualized at the program level. This allows the program manager to monitor the overall progress of the program against the initial baselines.
Consolidate program forecast and actual costs

Obtain a roll up of financial data from the delivering projects, based on the associated entities.

As a program progresses, the costs of associated projects are rolled up to the program level. When a project is associated to program(s), an allocation percentage is defined. This allocation percentage is used to roll up the project's cost to its associated program(s).

Monitor and manage program financials

Review and refine program financials based on the current view of how the program is being realized through the execution of its projects.

By comparing financial versions, it is possible to track the variance between the approved baseline costs and effort, and the current forecast to highlight any areas that require attention.

Understanding the program financials allows you to re-balance the overall program budget across the delivered projects, including reassignment of investment funds from one project to another, to reflect the baseline costs.

For more information:

Monitor and manage program roadmap

Maintain the target dates and milestones of the program. The Program Manager can align the program schedule and the schedule of associated projects.

For more information:

Update program status and narrative    
 

Update the program assessment indicator criteria and populate the program narrative or commentary with the appropriate values and information.

This information can then be exported as a summary of key information relating program execution into a one page report for program stakeholders and strategic review meetings.

The report includes the program attributes populated as part of this step, responsibility information, trend of program condition/RAG/RYG status, descriptive information, date and milestone information, financial summary, commentary and change request, risk and issue lists, plus key information on the associated projects that are delivering the program.

For more information:


Program Management Reports

How are we able to understand the work or projects delivering our programs?

Strategy Portfolio – Portfolio Manager – Hierarchy View Tile

The Strategic Portfolio – Portfolio Manager Tile – Hierarchy View gives you an overview of the strategic entities in a portfolio and easy access to edit the details of those entities. This view displays all levels of the strategy structure in a hierarchy tree, including the portfolio’s strategic entities and programs with associated real-time project data and related outcomes. Strategic entities can be edited directly on this screen, and programs are editable in their respective menus.

STR16 – Program Highlight Report

Analytic

This one-page report provides an executive summary of key program information for program stakeholders followed by detailed reports, including:

  • program responsibility information
  • program condition/RAG/RYG status
  • program dates and milestones
  • program financial summary
  • program commentary and change request/risk/issue lists
  • key information on associated projects delivering the program

This report can be run for a single program or a portfolio.

STR51 – Strategy Portfolio Associated Work Matrix

Analytic

This strategic portfolio-based bubble chart supports the tracking of the performance of projects associated with programs. Project measures such as cost of effort can be plotted against project status dimensions such as lifecycle stage and project condition. This provides a value vs. cost visualization of the strategic portfolio. You can select different project-based dimensions such as attributes and measures such as effort or financials for plotting the matrix.

STR52 – Strategy Portfolio Associated Work Balance Analytic

This strategy portfolio-based report shows status and data on the projects associated to the programs and initiatives in the portfolio.

How are we able to understand the impact of shifting work or project schedules on our program roadmap?

Strategy Portfolio – Portfolio Manager – Roadmap Column Set – Hierarchy View Tile In the Strategic Portfolio – Portfolio Manager Tile – Hierarchy View, toggle the Roadmap Column Set to display the current and baseline roadmap schedule, stages, and milestones.

How are we able to understand the health of programs in our portfolios?

FastTrack Power BI Showcase Dashboards – Strategy – Strategy Portfolio Balance Power BI Dashboard  This dashboard counts the strategic initiatives and programs in select portfolios by the line of business, sponsorship, and initiative drivers. You can slice data by portfolio and view an overall status assessment for each project. 
FastTrack Power BI Showcase Dashboards –Strategy – Strategy Financial Analysis Power BI Dashboard  This dashboard shows the forecasted costs of strategic initiatives and programs in select portfolios, allowing you to identify the trend of forecasted costs over time. You can configure the dashboard to slice and display data in numerous ways.


Program Management Process Steps


Program Management Process flow 1200.jpg

Program management process flow


Process Step Description
Do work Resources carry out the work that has been assigned to them.
Deliver program through underlying projects Relevant project managers monitor and manage all captured information on project status and progress as resources execute projects and deliver work. This information can also be consolidated and visualized at the program level. This allows the program manager to monitor the overall progress of the program.
Consolidate program forecast and actual costs Obtain a roll up of financial data from the delivering projects, based on the associated entities. As a program progresses, the costs of associated projects are rolled up to the program level.
Monitor and manage program financials Review and refine program financials based on the current view of how the program is being realized through the execution of its projects.
Monitor and manage program roadmap Maintain the target dates and milestones of the program. The program manager can align the program schedule and the schedule of associated projects.
Update program status and narrative Update the program assessment indicator criteria and populate the program narrative or commentary with the appropriate values and information.


Program Management Reports

There are several standard reports for program management in the report library. These can be run with specific filters to see the appropriate information. 

You can also access a program dashboard and report set for program managers that highlight upcoming milestones, financial planning, and more. The reports and dashboard can be copied and adapted to meet your organization’s specific requirements.