
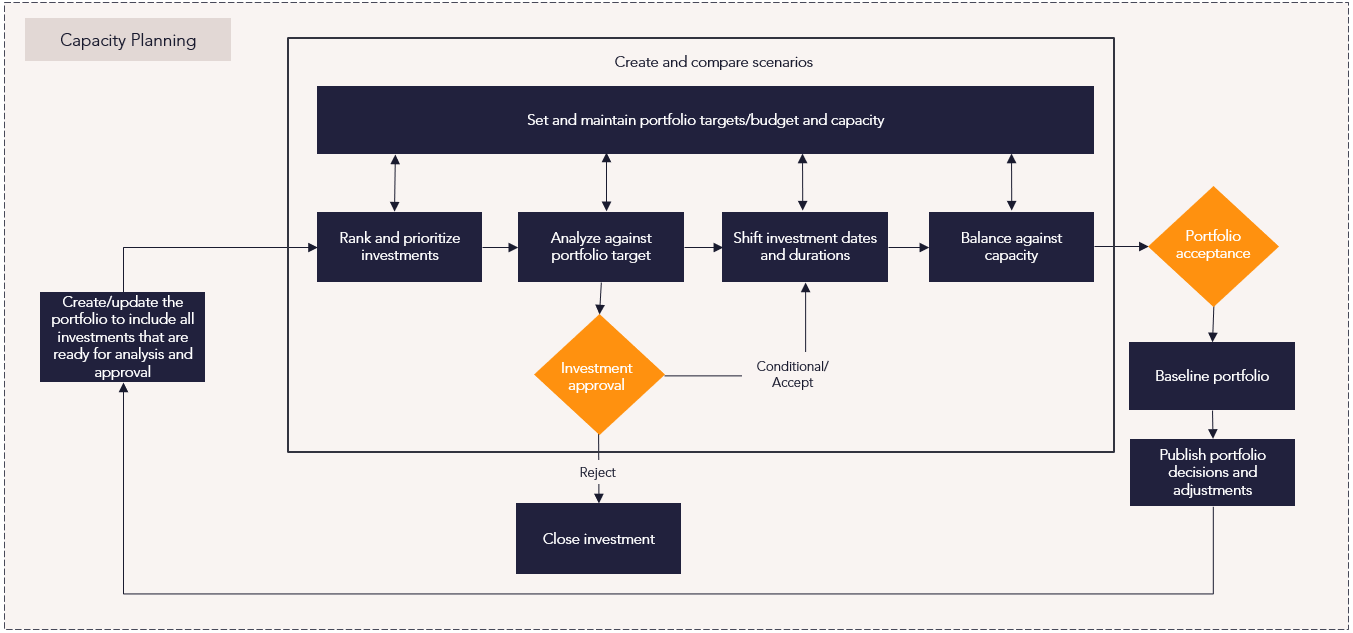
Portfolios process flows
Overview
Implementing capacity planning enables organizations to remain flexible and respond rapidly to changing priorities. Using robust investment, demand, and capacity data, managers can make iterative planning decisions about which investments to prioritize based on their capacity targets. Portfolio and resource managers can analyze and evaluate active and pipeline investments on a continuous basis, revisit assumptions, and make trade-off decisions to optimize their resources and costs. In Planview Portfolios, capacity planning is typically performed in tandem with Prioritization and Scenario Analysis.
New to capacity planning? Watch the demo video for a quick overview:

Process steps
| Process Step | Description |
|---|---|
| Create a scenario |
Creating investment and capacity planning scenarios allows you to model different investment decisions and various approaches to balancing investment demand with capacity. Creating a shared scenario allows you and others who have access to the relevant portfolio to work in a what-if environment until a particular scenario is ready to be published and shared as your organization's investment plan. When working in a shared environment, you and other users review the same proposed investment plan so that each of you can examine and update those portions that affect your respective areas. A Planning portfolio can also include user-defined scenarios created to model and evaluate different investment decisions and approaches to balancing capacity with demand in a what-if environment. Data in those scenarios can be modified without affecting the corresponding data in the portfolio's relevant financial plan as changes are made. For more information: |
|
Set and maintain portfolio targets/budget and capacity |
Analysis of investments is achieved by comparing what’s available—capacity (which can be in the form of resource capacity or a financial budget)—versus demand (derived by the forecast of work in the portfolio). To carry out and understand portfolio investment planning, it's essential that an accurate recording of your target budget and resource capacity is captured. The detail of the summarized capacity totals can be drilled into via the Financial Planning Detail screens associated with each capacity entity. Capacity budgets and targets can also be managed from within a Planning portfolio. The Capacity Portfolio Manager shows a summarized capacity total broken down by the capacity slicer in the portfolio definition. For more information: |
| Rank and prioritize investments |
Investment and Capacity Planning provides a mechanism to compile all investments (accepted, in-flight, and potential investments) and carry out an assessment and approval in the context of the whole portfolio. The Rank view within Investment and Capacity Planning provides the ability to sort the list of investments based on subjective or qualitative scoring and prioritization criteria to prioritize investments within the portfolio. This ranking is then used in subsequent screens in Investment and Capacity Planning as sorting criteria. Investments can be ranked automatically based on criteria and/or manually by the users of each scenario. Investments are displayed in ranked order within a scenario. If no ranking has been applied, investments are displayed alphabetically. If a scenario includes both ranked and unranked investments, unranked investments will display at the top in alphabetical order, and the ranked investments will display below in ascending order of their ranking.
Planning Manager tile – ranking investments
Planning Manager tile's Rank view – rank investments automatically For more information: |
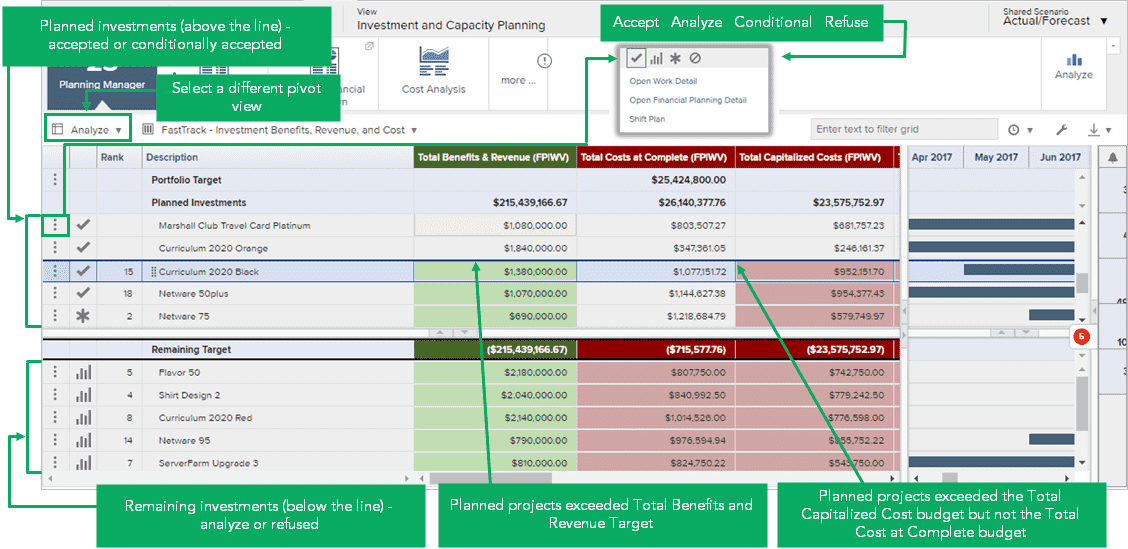
| Analyze against portfolio target |
The objective of this step is to confirm the approval of investments within the portfolio targets/constraints of costs and resource capacity. The Analyze view provides the ability to approve investments by moving them above the line (accepted) and seeing the impact on overall budgetary constraints and capacity. Any changes to the Investment Approval Status and Internal Priority in the Investment and Capacity screens are "what-if" changes and are not confirmed until the scenario is published to execution. To analyze investments "above and below the line":
Planning Manager tile – analyzing investments For more information: |
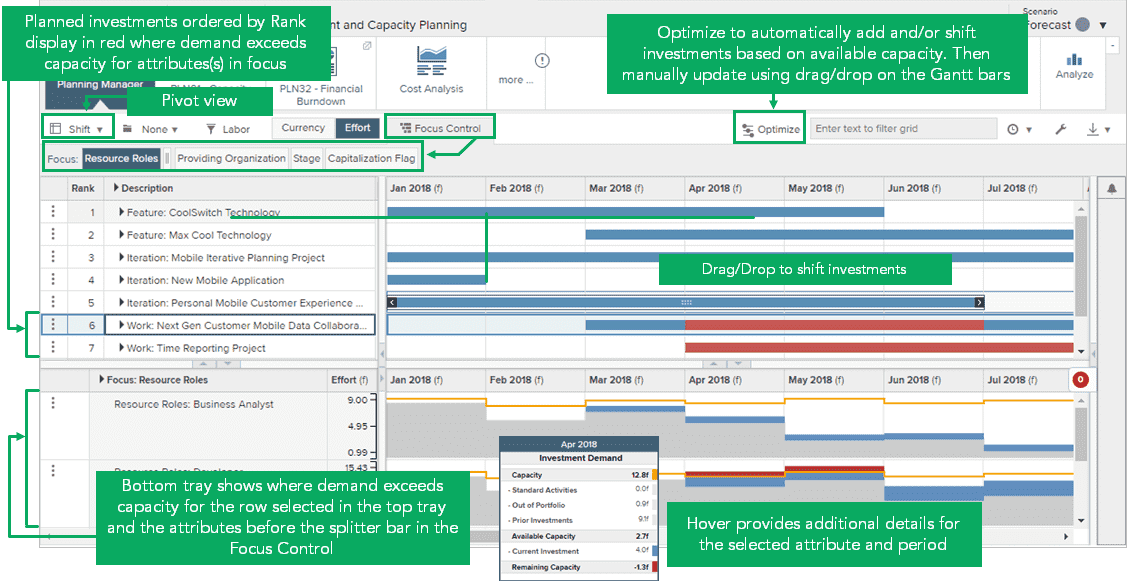
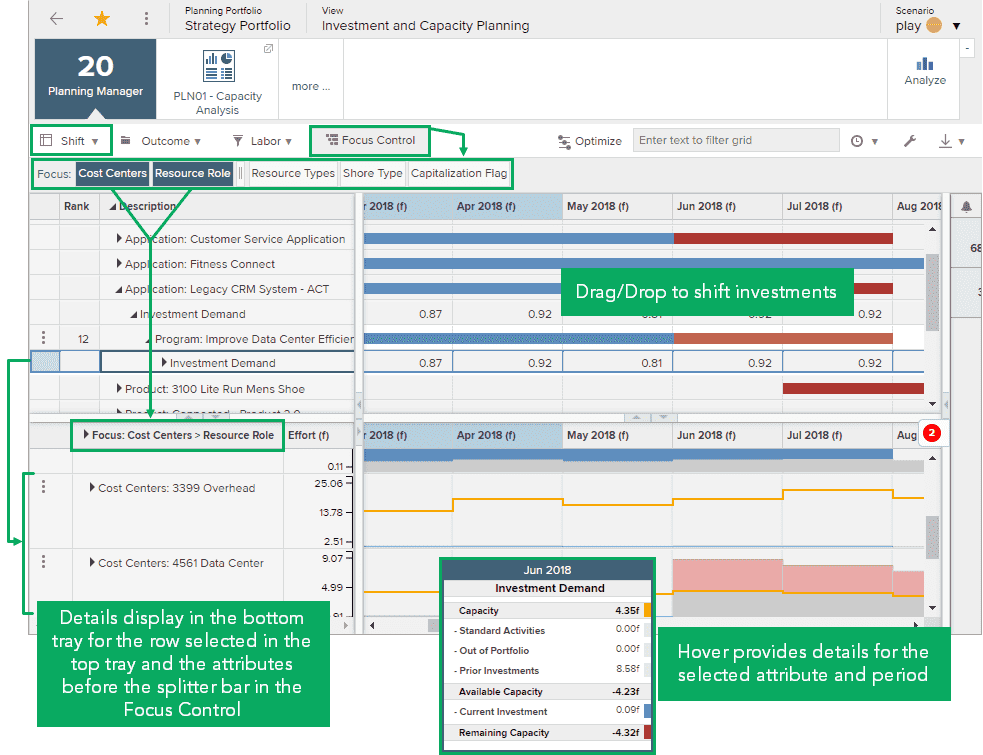
| Shift investment dates and durations |
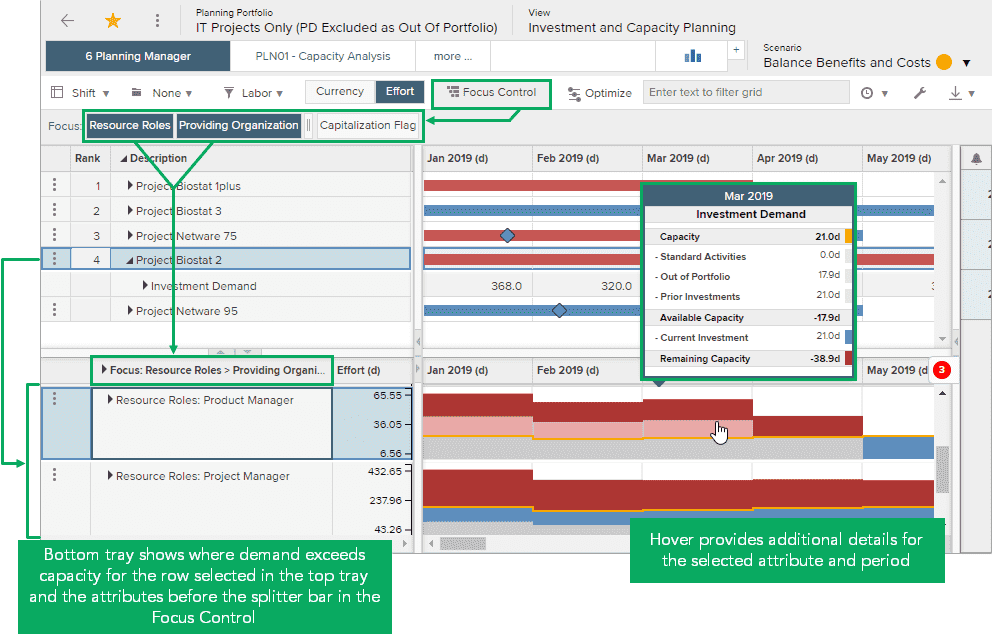
The Shift view provides visibility of where demand exceeds capacity by period, as well as the ability to shift investments to fit within available capacity. After portfolio investments have been ranked and analyzed, date ranges of approved and conditionally-approved investments are further evaluated. Constraint limitations on specific resource types may be resolved by shifting investment dates, and investments below the line may be approved.
Planning Manager tile – shifting investments
Planning Manager – shift highlighting bottom tray details
Planning Manager tile – shift highlighting bottom tray details
For more information: |
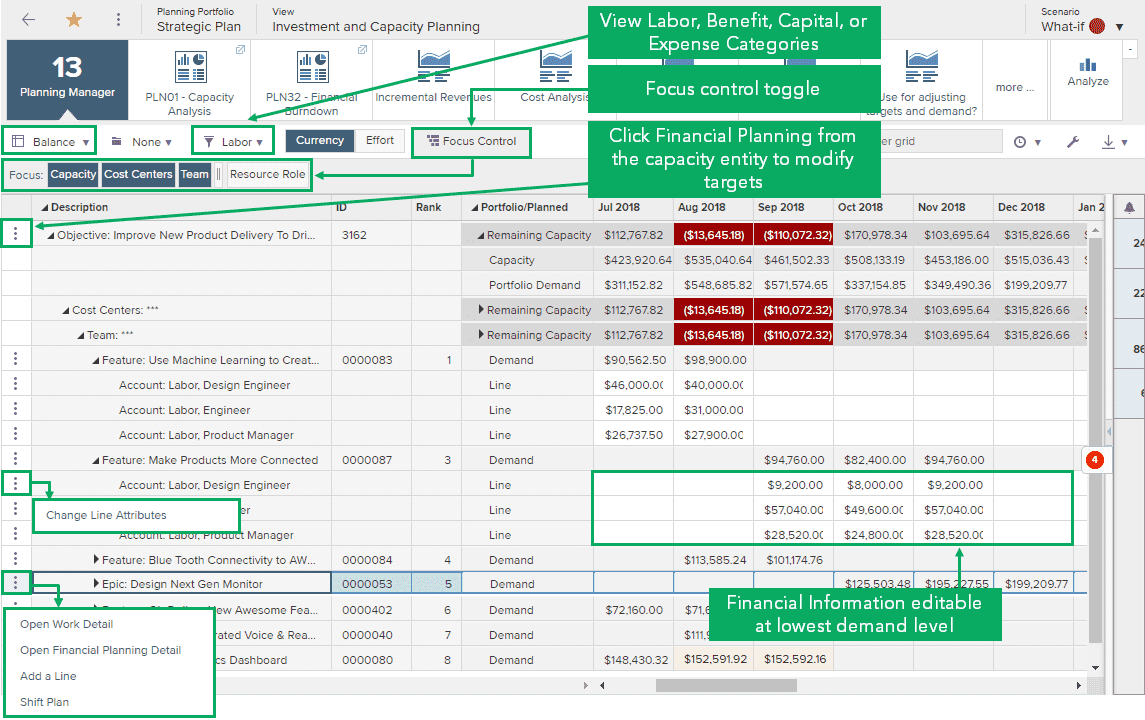
| Balance against capacity |
The objective of this step is to identify resource capacity/demand issues or cost time-phasing issues and to smooth demand across time to plan to deliver the programs within the capacity and time-phased budget targets. The Balance view allows you to look at investments that have been accepted in the scenario, and the time-profiled impact of those investments against the capacity and budget targets. To balance investments:
Note: it's important to not accidentally model what-if decisions on the Shared Scenario. What-if modeling should be done on user-created scenarios and published to the shared scenario when you are ready to commit to the plan.
Planning Manager tile – balancing investments
For more information: |
| Baseline portfolio |
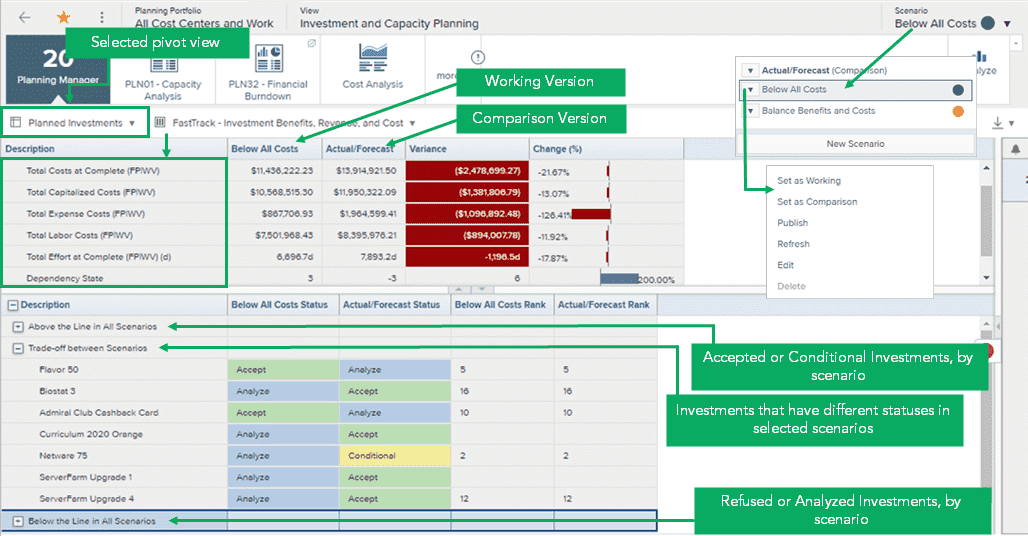
The purpose of this step is to capture a portfolio baseline in order to create a snapshot of the investment decisions and investments as of the end of the investment planning cycle. As the investment portfolio evolves and the program landscape continues to change, new programs arrive, or planned programs fluctuate in risk, forecasted cost or strategic alignment, a continuous reassessment of investment decisions and priorities will force amendments to the investment planning portfolio. This working version can then be compared against the baseline and variances analyzed. After creating versions, it's important to assign the correct Working Version or Comparison Version tags to see their respective values in column sets. See Managing Investment and Capacity Planning Scenarios for more information. The Planned Investments comparison view highlights financial differences between the working version and the comparison version. The top tray compares financial data differences based on the selected column set. The bottom tray compares investment approval status and rank order.
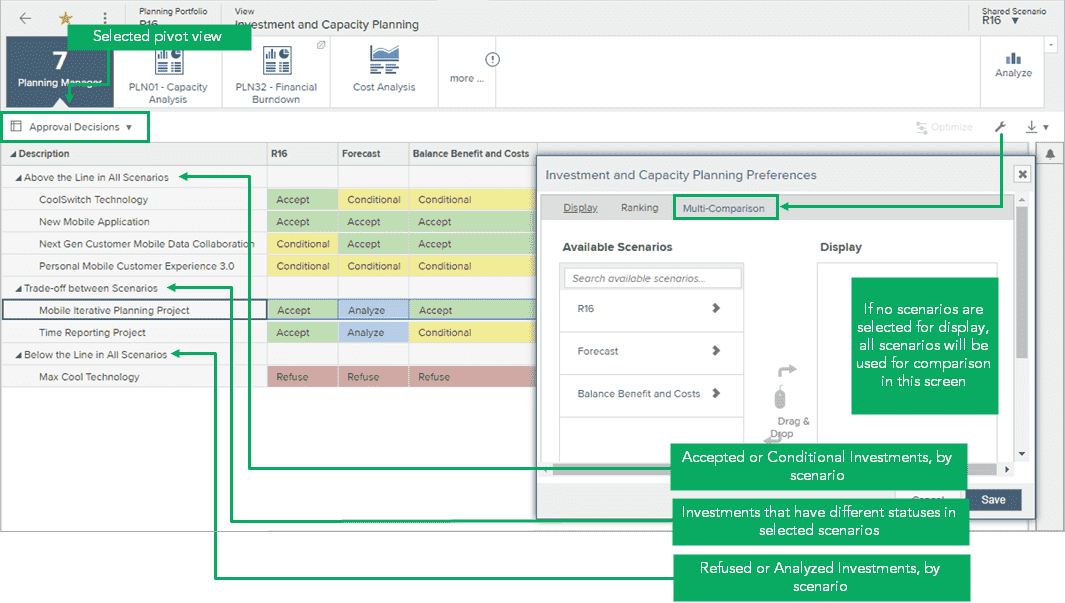
Planning Manager tile – Planned Investments pivot view The Approval Decisions view compares Investment Approval statuses for multiple scenarios. Selection of scenarios is made in the Investment and Capacity Planning screen's preferences. If no scenarios are selected, this screen compares all scenarios. Investments are displayed in the same way as the bottom tray of the Planned Investments comparison view—by Above the Line, Trade-off, and Below the Line.
Planning Manager tile – Approval Decisions pivot view For more information: |
| Compare scenarios |
By comparing multiple scenarios, you and other users who have access to a relevant portfolio can work in a what-if environment until a particular scenario is ready to be published and shared as your organization's investment plan. Data in those scenarios can be modified without affecting the corresponding data in the portfolio's relevant financial plan as changes are made. If there are multiple scenarios within a Planning portfolio, designate your Working scenario, then compare Planned Investments or compare Approval Decisions to display information to help you identify differences relevant to the financial data, investment approval status, ranking values of investments, and trade-off of approval decisions. |
| Publish portfolio decisions and adjustments |
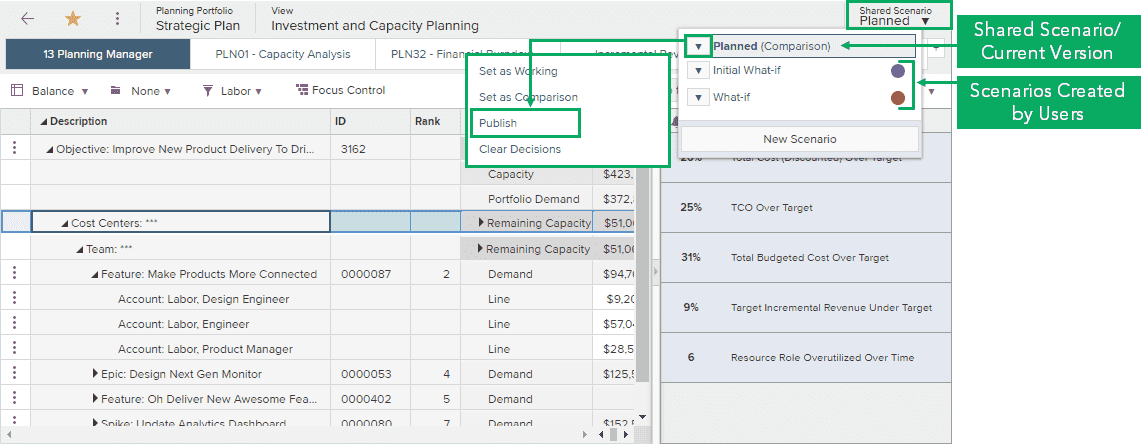
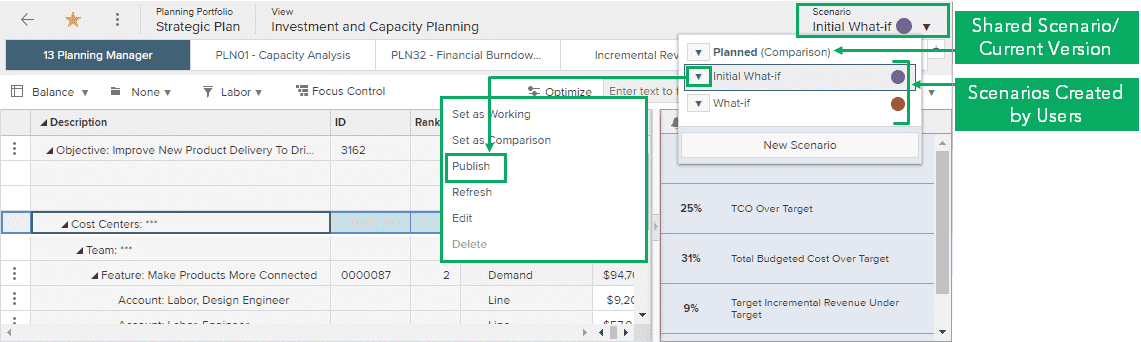
The purpose of this step is to publish the investment approval decisions that were made to the scenario during the ranking, analyzing, shifting, and balancing of investments versus organizational capacity. Based on the above-the-line (accepted) and below-the-line decisions made during this investment planning process, the Investment Approval Status values are updated accordingly—all accepted programs will be changed to an Investment Approval Status of Accepted. Investment Approval decisions made in a scenario are "what-if" and not visible and live until the publishing process is completed.
Note: in addition to investment approval decisions, any amendments to demand data of investments or the capacity/budget targets within the (non-shared) scenario will also be published live and update the financial planning detail screens accordingly for the investments and/or capacity in question.
Planning Manager tile – publish from the shared scenario
Planning Manager tile – publish from scenarios created by users (non-shared)
For more information: |
| Close investment |
The purpose of this step is to change the status of refused programs to Closed. If the program was in progress, any projects allocated to the program would need to be closed as well to prevent accumulation of additional time and costs. This step can be executed as part of a lifecycle process or completed manually. For more information: |
Reports
How are we able to understand our capacity targets?
| Planning Portfolio – Planning Manager – Rank and Analyze Pivot Views | Tile |
In the Planning Portfolio – Investment and Capacity Planning View, use the Planning Manager Tile to view investments and make decisions based on portfolio financial targets and capacity targets.
|
| PLN01 – Investment Planning Demand vs. Portfolio Targets | Analytic |
This analytic summarizes data in an investment planning portfolio scenario by providing a time-phased view of the portfolio demand and targets. Portfolio demand is compared to the capacity of resources or funds required to deliver the portfolio, or to the benefits/revenue the portfolio must deliver. This analytic supports project, strategy, and product-based portfolios. |
| STR32 – Strategic Portfolio Financial Performance | Analytic |
This report compares versions of the strategic program and summarized portfolio financial plan data, with effort represented as FTEs, days, and hours, and financials as cost, benefits, and revenue. The report includes a burndown chart for the portfolio and each initiative. You can run the report against each level in the strategy structure. |
| WRK32 – Project/Work Portfolio Financial Burndown Comparison | Analytic |
This report compares versions of project and work portfolio financial plan data, with effort represented as FTEs, days, and hours, and financials as cost, benefits, and revenue. The report includes the following:
|
| STR33 – Strategic Initiative Pipeline Matrix | Analytic |
This report can select cost, revenue, or benefit-based measures from the financial planning data to drive bubble size and visualize the pipeline of strategic initiatives. You can configure the report to run against each level in the strategy structure. |
| WRK33 – Project Cost or Revenue/Benefit Bubble | Analytic |
This report can select cost, revenue, or benefits-based measures from the financial planning data to drive bubble size. |
| RES03 – Resource Portfolio Supply and Demand | Analytic |
This analytic provides an organizational view of resource capacity versus demand. Demand is based on requirements, reserves, and allocations in project schedules, and data can be pivoted by different resource dimensions. This analytic allows you to identify teams or resources that are under- or over-utilized, and improve project delivery estimations based on available capacity. |
| Configurable Analyze Tiles | Tile |
The configurable Analyze tile allows you to create custom chart tiles, table tiles, Power BI tiles, and visual tiles. Administrators can create shared configurable chart and table tiles, and control who has access to the Analyze tile. |
How are we able to balance remaining capacity against new demand?
| Planning Portfolio – Planning Manager – Shift and Balance Pivot Views | Tile |
In the Planning Portfolio – Investment and Capacity Planning View, use the Planning Manager Tile to view current and pipeline investments and make decisions based on portfolio financial targets and capacity targets.
|
| PLN01 – Investment Planning Demand vs. Portfolio Targets | Analytic |
This analytic summarizes data in an investment planning portfolio scenario by providing a time-phased view of the portfolio demand and targets. Portfolio demand is compared to the capacity of resources or funds required to deliver the portfolio, or to the benefits/revenue the portfolio must deliver. This analytic supports project, strategy, and product-based portfolios. |
| PLN32 – Planning Portfolio Financial Burndown Comparison | Analytic |
This planning portfolio report creates a time-phased financial burndown chart of the whole planning portfolio or each individual project, allowing you to track actual burn and forecast burn to ensure that spend, effort, revenue, or benefits are in line with projections. This report compares versions of the financial plan with effort represented as FTEs, days, or hours, and financials as cost, benefits, or revenue. |
| Configurable Analyze Tiles | Tile |
The configurable Analyze tile allows you to create custom chart tiles, table tiles, Power BI tiles, and visual tiles. Administrators can create shared configurable chart and table tiles, and control who has access to the Analyze tile. |
| Resource Management and Assignment Portfolio Screen | Screen |
The Resource Management and Assignment Portfolio screen provides a graphic view of planned versus actual effort. You can filter by entity type or use the ‘Group By’ attribute to see a resource team. Standard activities decrement from capacity then allocations, reserves, and actuals. |
| RES03 – Resource Portfolio Supply and Demand | Analytic |
This analytic provides an organizational view of resource capacity versus demand. Demand is based on requirements, reserves, and allocations in project schedules, and data can be pivoted by different resource dimensions. This analytic allows you to identify teams or resources that are under- or over-utilized, and improve project delivery estimations based on available capacity. |
| WRK29 – Resource Utilization | Analytic |
This report displays the capacity and utilization of resources assigned to a portfolio or project. Demand is based on requirements, reserves, and allocations in project schedules, and data can be pivoted by different resource dimensions. Out-of-portfolio demand (assignments to work and standard activities not included in the portfolio or project) can also be displayed. This report allows you to identify over- and under-utilized teams or resources and better predict project delivery dates based on the alignment of supply to demand. |
How are we able to balance capacity across time to eliminate or reduce constraints?
| Planning Portfolio – Planning Manager – Shift and Balance Pivot Views | Tile |
In the Planning Portfolio – Investment and Capacity Planning View, use the Planning Manager Tile to view current and pipeline investments and make decisions based on portfolio financial targets and capacity targets.
|
| Configurable Analyze Tiles | Tile |
The configurable Analyze tile allows you to create custom chart tiles, table tiles, Power BI tiles, and visual tiles. Administrators can create shared configurable chart and table tiles, and control who has access to the Analyze tile. |
| Resource Management and Assignment Portfolio Screen | Screen |
The Resource Management and Assignment Portfolio screen provides a graphic view of planned versus actual effort. You can filter by entity type or use the ‘Group By’ attribute to see a resource team. Standard activities decrement from capacity then allocations, reserves, and actuals. |
Best practices
Ensure resources have the right skill set
The lack of necessary skill sets to deliver required outcomes is common, especially for high-demand skills. Compare the required skillsets against those your teams possess and ensure teams are fully dedicated to work execution that delivers value. Build out dedicated teams with the highest-demand skills for the work you're committing to in your planning cycle.
Progress team structures
Regularly reassess the needs of the organization and its projects, and adjust teams accordingly to better support new systems. Smaller, dedicated, product-centric teams adapt more easily to change and can increase product line capacity when needed.
Avoid multi-teaming
Avoid having shared resources work across multiple projects. Multi-teaming can link the fate of otherwise independent projects, risking delays across all projects. Give teams autonomy to pull from prioritized backlogs when work stalls, enabling them to deliver value.
Perform scenario-driven capacity planning
Model resource and portfolio scenarios based on utilization, capacity, and funding to compare against benefits, risks, and ROI. This helps balance trade-offs and evaluate alternative staffing and funding approaches to achieve portfolio objectives.
Forecast using real-time visibility
Ensure real-time visibility into resource workloads as work progresses. This helps you accurately forecast future resource demand and plan for any gaps, such as hiring decisions or skillset needs.
Don’t overestimate capacity
When forecasting capacity and velocity, don’t count open roles as available resources. New hires might not have the required skillsets or product knowledge. Only commit to deliverables that can be achieved with existing capacity.
Expect and alleviate disruption
Recognize that unforeseen issues will arise, potentially affecting deadlines. Streamline governance, remove process-heavy procedures, and give teams autonomy in terms of approvals (within specific parameters) to help alleviate disruption.
Generate consistent and reliable reports
Reliable, consistent reporting enables better-informed leadership decisions when planning, prioritizing, and reprioritizing initiatives. Reports provide real-time visualization to address staffing issues quickly.
Prioritize using Weighted Shortest Job First (WSJF)
Prioritize projects based on the estimated cost of delay divided by duration. This method, WSJF, focuses on projects that offer the most value in the least amount of time, considering financial cost, customer value, time sensitivity, risk reduction, and new opportunity enablement.
Work in small batches
Break initiatives into Minimal Viable Products (MVPs) or Minimum Business Increments (MBIs). This ensures manageable small batches, allowing teams to work efficiently and avoid overloading. Collaborate to finish existing tasks before taking on new work.
Focus on the intake process
Control your work intake to maximize team capacity. Limit Work In Progress (WIP), create visibility into the project backlog, and ensure resources pull work only when ready. This ensures teams focus on the right number of projects at the right time.